

THE DOCTRINE SERIES · STUDY NO. 03
The Taxonomy of Liquidity
On the provenance of market depth — its sectors, its providers, its mechanics, and the discipline of verifying, rather than accepting, the claim of any institution to supply it.
ARCHITECTURE · DOCTRINE

STUDY NO. 03
Abstract
Liquidity is not a single substance distributed evenly across markets. It is a family of distinct commodities — each sourced from a different type of provider, priced by a different mechanism, and vulnerable to a different kind of failure. A pension fund selling a block of equities, a corporate treasurer hedging FX exposure, a family office exiting a real estate position, and a trader closing a position on a decentralized exchange are all, in the loosest sense, “seeking liquidity.” But the liquidity each one finds is manufactured by an entirely different class of institution, under an entirely different set of incentives. This study catalogs those providers — by name, by sector, and by method — opens the mechanics of the quote itself, sets out how execution quality is actually measured, and closes with the discipline required to construct a provider, to select one, and to distinguish a genuine one from an entity merely claiming the title.
Definition — Market Liquidity vs. Funding Liquidity
Market liquidity is the ease with which an asset can be bought or sold without materially moving its price. Funding liquidity is the ability of an institution to meet its cash obligations as they fall due. The two are related but distinct — a bank can hold assets that are perfectly liquid in the market and still fail if it cannot fund its own balance sheet overnight. The events that define financial crises are almost always the moment these two liquidities collapse into one another: a funding shortfall forces asset sales, the sales move prices, and the moved prices trigger further funding shortfalls elsewhere.
Liquidity is not a commodity. It is a chain of trust and credit — and the distance between a participant and the apex of that chain is what determines execution quality when it matters.
Exhibit · The Architecture of This Study
- IThe TaxonomyLiquidity by sector, and the FX hierarchy in full.
- IIProfiles of the ProvidersThe economics behind the quote — why each provider withdraws.
- IIIOperational MechanicsOrder books, execution algorithms, dark pools, synthetic provision.
- IVThe Anatomy of a QuoteLast look, conditional rejects, and skew — where the economics sit.
- VMeasuring ExecutionMark-outs, effective spread, and the discipline of transaction-cost analysis.
- VIRisk & MacroLiquidity spirals, the illiquidity trap, and the settlement frontier.
- VIIConstructing a ProviderThe operational requirements of standing inside the taxonomy.
- VIIISelecting a ProviderA due-diligence framework across institution types.
- IXThe False ClaimDistinguishing a genuine provider from one merely claiming the title.
- XNetting & SettlementHow providers actually exchange value among themselves.
Note — On the Figures in This Study
Two classes of number appear in these pages and are never mixed. Published figures — from the BIS Triennial Survey, CLS Group, the Bank of England, and named academic work — carry their source beneath them. House estimates — operational benchmarks drawn from X-CHASE engagement experience, for which no public series exists — are marked house estimate at the point of use. They are offered as calibration starting points, not as measured statistics.
The Taxonomy — Liquidity by Sector
Liquidity is not homogeneous. Each asset class has developed its own provider ecosystem, shaped by the nature of the underlying instrument, its settlement mechanics, and the regulatory regime that governs it.
Equities & Fixed Income
In listed equities, liquidity is supplied primarily by registered market makers and high-frequency trading firms operating under exchange-sponsored programs. Citadel Securities and Virtu Financial are, by volume, the two largest wholesale market-makers in U.S. equities, internalizing a substantial share of retail order flow before it ever reaches a public exchange. Jane Street and Susquehanna International Group (SIG) operate similarly across equities and listed derivatives, with particular depth in ETF creation and redemption — a function that keeps an ETF’s market price tethered to its underlying basket. In fixed income, the picture is different: liquidity is thinner and more dealer-dependent. Primary dealers — a designated group of banks including JPMorgan, Goldman Sachs, Citigroup, and BNP Paribas — stand as the counterparties of first resort in U.S. Treasury markets, while corporate bond liquidity increasingly runs through electronic platforms such as MarketAxess and Tradeweb, which aggregate dealer quotes into a competitive request-for-quote environment.
Series Note — On Tier Numbering
This study extends Study No. 01 — The Liquidity Pyramid from structure to census: from the shape of the hierarchy to the names, motives, and mechanics inside it. The two use different registers deliberately. Study No. 01 numbers the system, beginning at Tier 0 — the central bank and the interbank market — because its subject is the transmission of funding conditions from the apex downward. This study numbers the market as a counterparty faces it, beginning at Tier 1 — the dealing banks and their non-bank equivalents — because its subject is the credit chain a participant must actually construct or select. Tier 1 here is Tier 1 there; what has been set aside is the central bank, which quotes no one a price.
The Empirical Record
- $9.6TGlobal FX turnover per day · April 2025 — BIS Triennial Central Bank Survey, 2025
- +28%Growth in daily FX turnover since 2022 — BIS Triennial Central Bank Survey, 2025
- $7.9TAverage daily value settled via CLS PvP · H1 2025 — CLS Group, Interim Report 2025
Foreign Exchange — The Liquidity Pyramid, in Full
FX is the deepest market in the world by daily turnover — $9.6 trillion per day as of the BIS’s April 2025 Triennial Survey, the highest figure recorded since measurement began in 1986 — and the clearest illustration of a tiered liquidity hierarchy. The table below sets out that hierarchy in the granularity an institution actually needs when evaluating — or constructing — a liquidity chain, rather than treating “liquidity provider” as a single undifferentiated category.
Exhibit I — The FX Liquidity Pyramid, by Tier
| Function | Representative names | |
|---|---|---|
| Tier 1 — Bank Market Makers | Trade directly with one another and the largest corporates and funds; quote the tightest spreads on the deepest size; the apex of bank credit. | JPMorgan, UBS, Deutsche Bank, Citigroup, Barclays, Goldman Sachs, HSBC, BofA Securities, Morgan Stanley, Standard Chartered |
| Tier 1 — Non-Bank Market Makers | Algorithmic principal liquidity streamed into the same venues as the banks, competing on latency and inventory management rather than balance-sheet size. | XTX Markets, Jump Trading, Hudson River Trading, Citadel Securities, DRW / Cumberland, Virtu Financial, Tower Research Capital, HC Technologies, GTS |
| Tier 2 — ECNs & Matching Venues | Neutral electronic venues on which Tier-1 liquidity is aggregated and matched under price-time priority, without the venue itself taking a position. | EBS Market (CME), LSEG FX (Refinitiv Matching, FXall), Currenex, LMAX Exchange, 360T, FXSpotStream |
| Tier 2 — Prime Brokers | Extend bank credit to counterparties who cannot trade directly under their own name, and net exposures across multiple executing venues under a single ISDA / give-up arrangement. | Morgan Stanley Prime, UBS Prime, Société Générale Prime Services, BNP Paribas Prime Brokerage |
| Tier 3 — Prime-of-Prime (PoP) | Repackage Tier-1 and Tier-2 liquidity for retail and institutional brokers who lack direct bank credit lines, taking on the credit and settlement risk the underlying banks are unwilling to extend downstream. | Sucden Financial, Invast Global, Advanced Markets, B2Prime, Finalto, IS Prime, Marex Prime Services, StoneX Prime Services, Divisa Capital |
| Tier 3 — Aggregation & Bridge Technology | The technical layer that blends multiple PoP and bank feeds into a single composite book, applies markup and last-look logic, and routes the result into a broker’s own execution engine. | oneZero, PrimeXM, Centroid Solutions, Gold-i, Brokeree Solutions, Tools for Brokers |
| Tier 4 — Execution Brokers | The retail- or institutional-facing broker itself, typically built on third-party trading infrastructure, at the furthest remove from the original bank quote. | MetaQuotes MT4 / MT5 infrastructure, Devexperts platform stack |
Source: Table 1 — The FX liquidity pyramid, by tier, function, and representative participants.
This hierarchy is not a loose commercial arrangement; it is built on a specific legal mechanism called the give-up. A trade executed by a Tier-4 broker’s client is, at each hop above it, re-executed in the name of the intermediary rather than the original party: the PoP faces the bank in its own name, and the broker faces the PoP in its own name.
This is precisely why the default of a small downstream broker does not, by itself, endanger a Tier-1 bank’s balance sheet — but it also means that genuine credit quality becomes progressively less visible the further down the chain a participant sits, since the due diligence performed at the bottom of the pyramid rarely reaches all the way to the top of it.
Exhibit II — The Give-Up Chain: Credit Substitution at Every Hop

The Ascendancy of the Non-Bank Tier
The scale of the non-bank tier is no longer a marginal phenomenon. Chaboud et al. (2022), analyzing EBS trading data, found that non-bank principal trading firms executing algorithmically accounted for more than 40% of all volume on that venue by mid-2021, and the BIS’s own Triennial commentary noted that trading between banks and non-bank financial institutions had, for the first time, surpassed interdealer trading volume outright. The 2025 Survey extended the pattern: prime-brokered spot turnover rose 62% in three years, to $1.28 trillion per day, and hedge funds and proprietary trading firms lifted their daily activity by 44%. The practical implication for anyone sourcing liquidity is that “the interbank market” and “the bank market” have stopped being synonyms.
Commodities & Physical Markets
Commodity liquidity has a dual character: a financial layer and a physical layer, and the two do not always move together. On exchanges — CME Group for energy and metals, ICE for oil and agricultural products — liquidity is provided by a mix of bank trading desks, proprietary trading firms, and commercial hedgers. Beneath the financial layer sits the physical trading houses — Vitol, Glencore, Trafigura, and Mercuria — who provide a different kind of liquidity entirely: the ability to source, store, and deliver the actual barrels or tonnes that the financial contracts merely reference. When financial liquidity dries up in a commodity, it is often the physical traders, with storage and logistics capacity the paper market cannot replicate, who remain able to transact.
Private Markets & Real Estate
Here liquidity is structurally scarce, and the entire pricing model is built around what is known as the illiquidity premium — the additional return investors demand for accepting that a position cannot be exited quickly. Secondaries funds such as Ardian, Lexington Partners, and Coller Capital exist specifically to provide liquidity to limited partners seeking to exit private equity commitments before the fund’s natural life ends, typically at a negotiated discount to net asset value. In real estate, liquidity is provided less by dedicated market makers than by a combination of REITs (which convert illiquid property into a tradable security), debt funds prepared to refinance stalled assets, and opportunistic capital — family offices and private credit funds — willing to transact quickly in exchange for a discounted price. The absence of a continuous order book means every private market transaction is, in effect, individually negotiated liquidity.
Cryptocurrencies & Digital Assets
Digital assets have produced the most structurally novel liquidity model of any asset class, running two parallel systems side by side. Centralized liquidity is supplied by crypto-native market makers — Wintermute, GSR, Jump Crypto, Cumberland (DRW’s digital asset arm), and Amber Group — who quote across major exchanges and OTC desks much as their traditional-market counterparts do. Custody and settlement infrastructure for institutional participants is typically provided through Fireblocks or Copper, both of which allow assets to be pledged as collateral without leaving secured custody — a mechanism increasingly used to extend prime-brokerage-style credit into digital assets. Decentralized liquidity, by contrast, is supplied not by an institution at all but by code: Automated Market Makers such as Uniswap, Curve Finance, and Balancer allow any participant to deposit assets into a liquidity pool and earn a share of trading fees, with prices set algorithmically by the ratio of assets in the pool rather than by a matched order book. This is liquidity provision without a liquidity provider in the traditional sense — a genuine structural break from every other sector in this taxonomy.
Exhibit III — Two Parallel Systems of Digital-Asset Liquidity
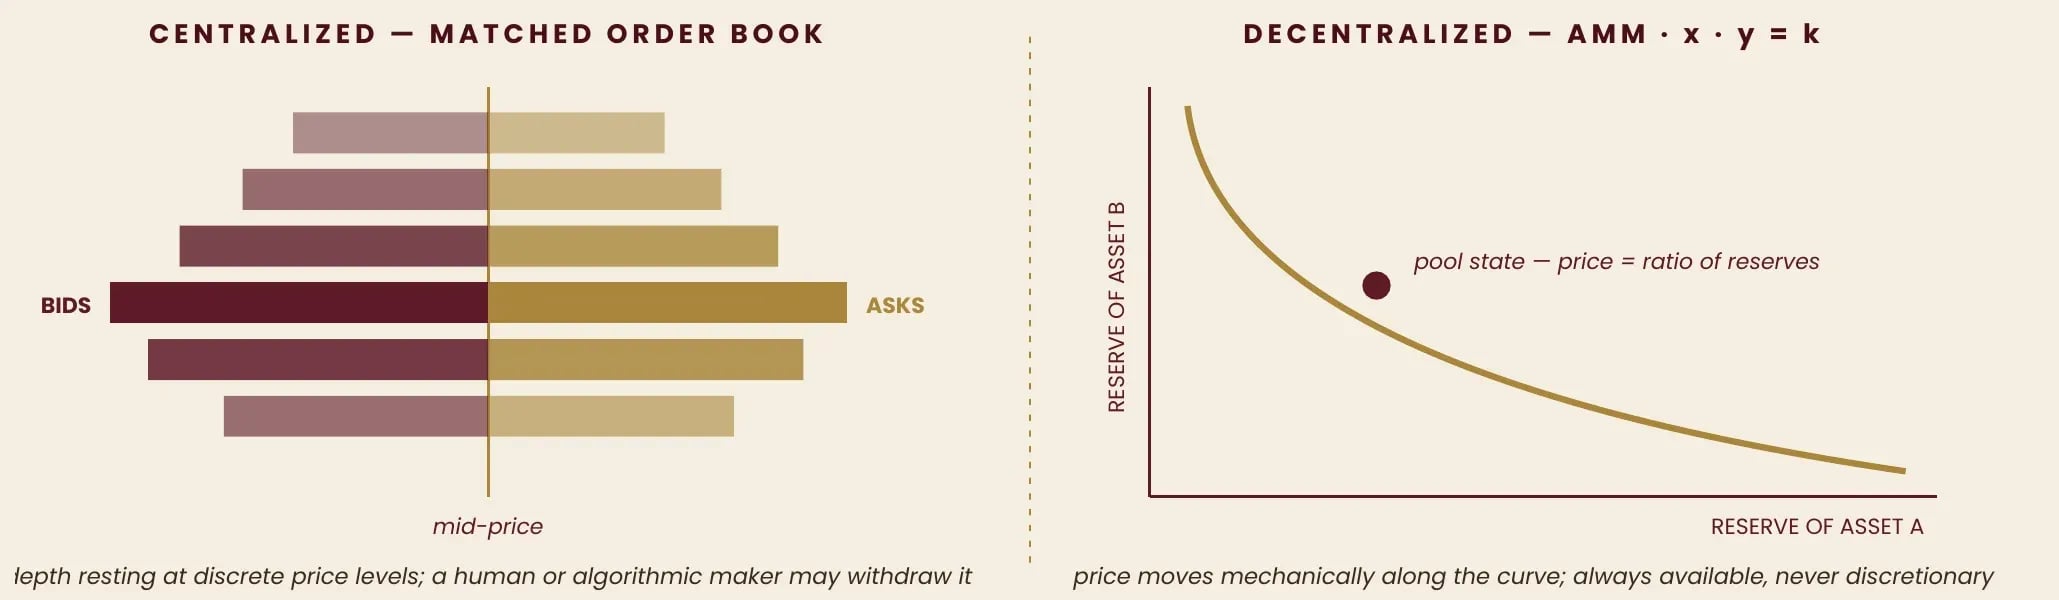
A pool that cannot widen its spread cannot refuse a trade. Availability, in code, is purchased with the surrender of discretion.
Profiles of the Providers — The Motivations Behind the Quote
Naming the participants is half the picture. Each type of provider brings a different economics to the quote, and that economics — not its marketing — determines when the quote will be withdrawn.
The Banks — Internalization, Inventory, and the Cost of Balance Sheet
For most of the twentieth century, bank liquidity was principal liquidity: a desk took the other side of a client’s order onto its own balance sheet and warehoused the risk until an offsetting trade appeared. Post-2008 capital rules — risk-weighted assets, the leverage ratio, and the capital surcharges applied to the largest institutions — repriced that warehouse. Holding inventory now consumes a scarce and expensive resource, and the modern bank desk is measured less by the risk it is willing to hold than by its internalization ratio: the share of client flow it can match against other client flow, on its own book, without ever touching the external market. A high internalization ratio means the desk earns the spread twice and pays market impact once; a low one means it is passing its own hedging cost back to the client inside the quote — which is most of the observable difference between two banks quoting the same pair.
It also explains when a bank withdraws. A desk does not step back because it lacks capital in the abstract; it steps back when the expected holding period of the inventory it is about to acquire exceeds what its risk limits and its funding cost will tolerate. In volatility, that horizon collapses — and the desk’s first response is not to widen its two-way price but to skew it: to shade the side that would add to an unwanted position while continuing to quote a competitive price on the side that would reduce it. A client watching only the spread sees a functioning market. A client measuring the two sides separately sees exactly where the bank’s book is.
Non-Bank Principal Trading Firms — Speed, Mark-Outs, and Adverse Selection
The non-bank makers — Citadel Securities, XTX Markets, Jump Trading, Virtu, HC Technologies — run the opposite balance sheet: small, fast, and almost never overnight. They earn the spread across enormous volume and hold inventory for seconds rather than days. Their central discipline is not funding but adverse selection: the risk that the counterparty trading against their quote knows something they do not, and that the market moves against the fill immediately after it. They measure this continuously, and it explains how their liquidity behaves. Their defenders point to measurably tighter spreads and deeper posted size; their critics point to phantom liquidity — quoted size that vanishes in milliseconds the moment a large order attempts to trade against it. Both are describing the same mechanism from opposite ends. A firm that cannot warehouse cannot absorb, and a quote it cannot hedge within seconds is a quote it will withdraw rather than honor at a loss.
Institutional Investors — Shock Absorbers and Shock Transmitters
Pension funds, insurers, and sovereign wealth funds occupy a dual role. In calm markets their long horizons make them natural absorbers — a fund that does not need to sell today can buy from a distressed seller, supplying liquidity precisely when it is scarcest. But the same institutions become consumers of liquidity at the worst possible moment when leverage sits inside them: in September 2022, UK pension vehicles running leveraged Liability-Driven Investment (LDI) strategies were forced into synchronized gilt sales as rising yields triggered margin calls, compelling the Bank of England into an emergency program under which it purchased £19.3 billion of gilts to restore orderly conditions. Whether such an investor absorbs or transmits a shock depends far less on its mandate than on the leverage embedded in how it holds its assets.
Decentralized Protocols
DeFi pools replace a market maker’s judgment with a fixed formula — most commonly the constant-product model popularized by Uniswap, in which the product of the two reserves must remain constant, so price moves mechanically as the ratio of assets shifts. The result is liquidity that is always available and never discretionary. A human maker widens, skews, or withdraws when a market turns disorderly; an AMM, by construction, cannot, which is why depositors bear impermanent loss whenever the pooled assets diverge sharply in price. It is the same adverse-selection cost the non-bank maker measures — borne passively, by a depositor with no mechanism to respond to it.
Operational Mechanics — How Liquidity Actually Changes Hands
Order Book Dynamics
The Limit Order Book (LOB) is the foundational mechanism of most modern markets: a continuously updated ledger of resting buy and sell orders at specified prices, matched according to price-time priority. Depth in the book — the volume resting at each price level — determines market impact, the amount by which a large order moves the price against itself as it consumes successive layers of the book. A trader attempting to sell a position larger than the depth available at the best price will, without care, “walk the book,” accepting progressively worse prices at each level consumed — the central cost that every execution strategy below is designed to minimize.
Algorithmic Execution Strategies
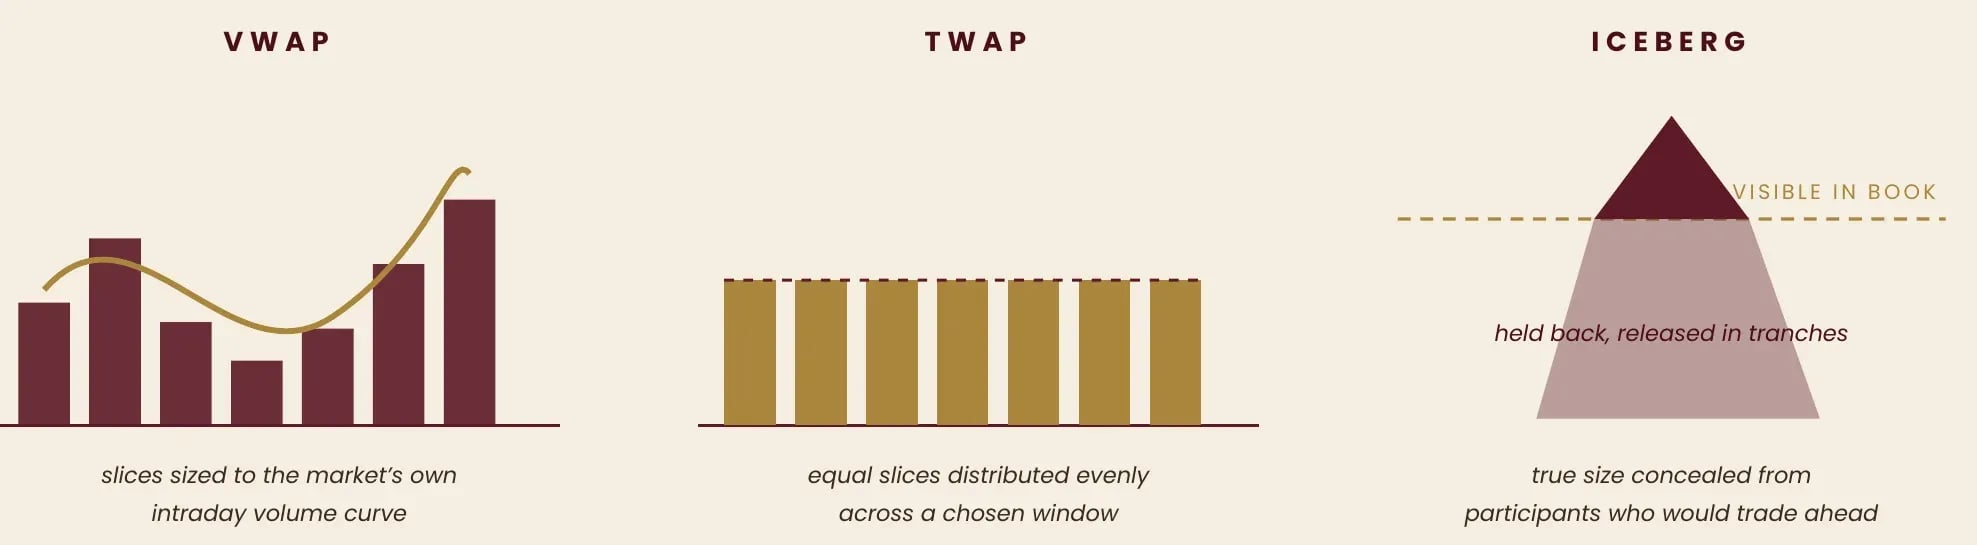
Institutional desks rarely send a large order to the market in a single clip; doing so would announce their intention and invite the market impact described above. Volume Weighted Average Price (VWAP) algorithms instead slice an order into smaller pieces, sized to match the market’s historical volume pattern throughout the day, so that the resulting average execution price tracks the market’s own volume-weighted average rather than any single moment’s price. Time Weighted Average Price (TWAP) algorithms follow the same logic on a simpler axis, distributing the order evenly across a chosen time window regardless of volume patterns — a coarser tool, but a more predictable one when volume itself is erratic. Iceberg orders address the same problem from a different angle: only a small visible portion of the total order is displayed in the book at any time, with the remainder held back and released in tranches as each visible slice is filled, concealing the true size of the underlying interest from other participants who might otherwise trade ahead of it.
Exhibit IV — Three Disciplines of Institutional Execution
Dark Pools & Mid-Point Matching
Not every institutional order can tolerate even the reduced footprint of an iceberg strategy. Dark pools — private trading venues operated by banks (Goldman Sachs’ Sigma X, UBS’s ATS) and independent operators (Liquidnet, Instinet) alike — allow large blocks to be matched away from public view, typically at the midpoint between the public market’s best bid and offer, with no pre-trade transparency at all. The trade is only reported to the public tape after execution. This sacrifices price discovery — a dark pool does not itself set the price, it borrows the midpoint from the lit market — in exchange for the ability to transact institutional size with materially reduced information leakage.
Liquidity Provision via Derivatives
Liquidity need not always be provided in the underlying asset itself. A Total Return Swap (TRS) allows one party to gain the full economic exposure of an asset — including both price appreciation and income — without ever owning it, while the counterparty providing the swap retains legal ownership and, with it, the ability to manage its own balance sheet and funding independently of the client’s position. Options serve a related function: a market maker writing options is effectively providing synthetic liquidity to a security’s volatility, allowing participants to express a view or hedge an exposure without transacting in the underlying at all. Both mechanisms let liquidity providers separate the risk they are willing to warehouse from the balance sheet required to hold it outright — one of the principal reasons derivatives markets have grown, in notional terms, so far beyond the cash markets they reference.
The Anatomy of a Quote — Last Look, Rejects, and Skew
Everything to this point concerns who quotes and through what mechanism. This section concerns the quote itself — because in the over-the-counter markets that carry most institutional liquidity, a price on a screen is not an executable commitment. It is a conditional offer, and the conditions attached to it are where the real economics of a liquidity relationship live.
The Last-Look Window
The Three Parameters of a Last-Look Policy
Hold time — how long the provider may wait before deciding. Price tolerance — how far the market may move before a request is rejected. Symmetry — whether that tolerance is applied identically to moves in the client’s favor and against it. A provider that will not state all three in writing has not disclosed its last-look policy, whatever its documentation says.
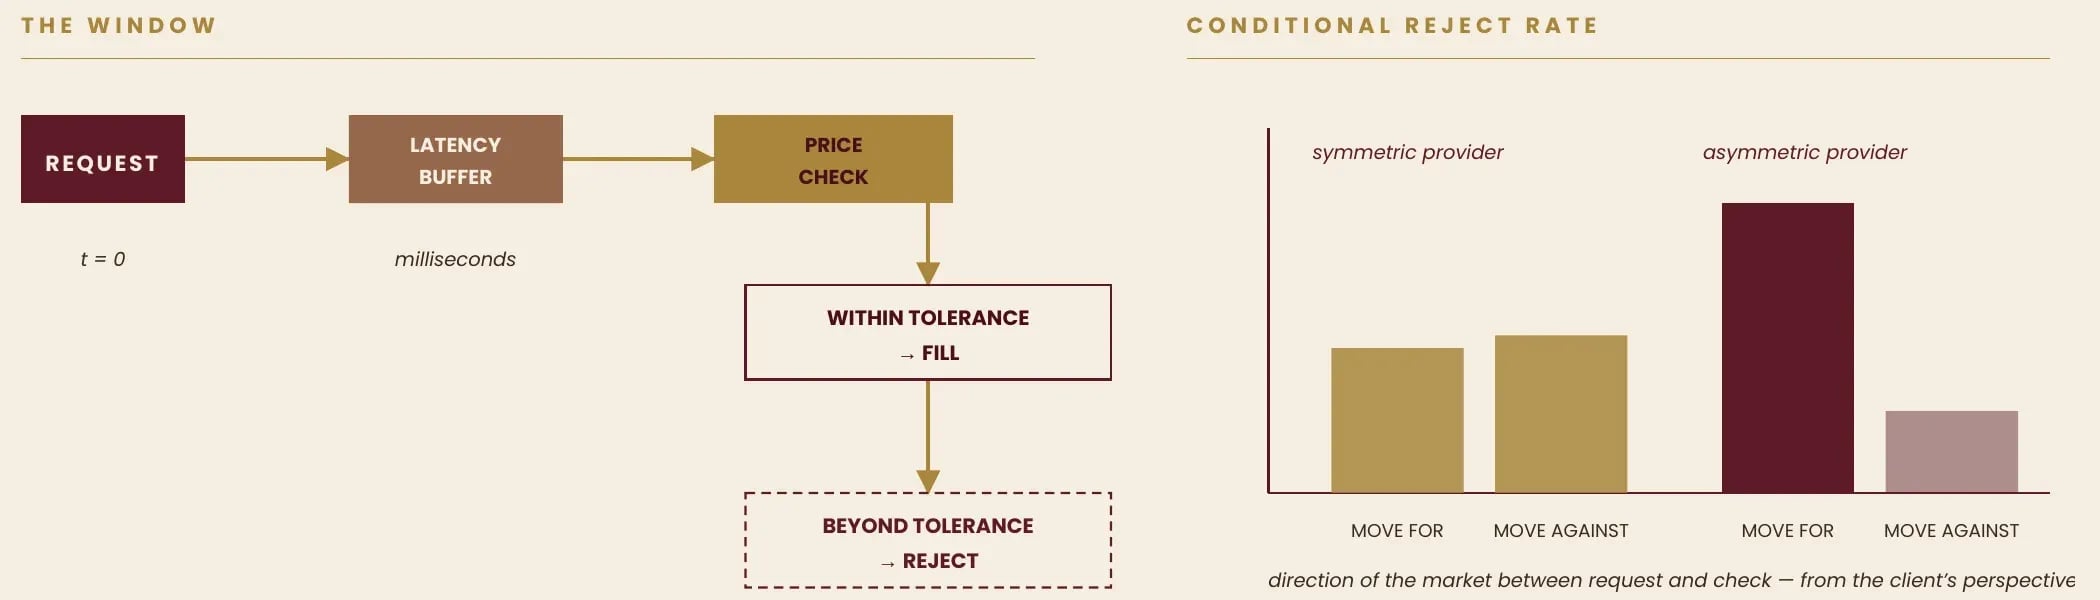
Last look is the practice by which a provider, on receiving a trade request against its own quoted price, applies a brief final check before accepting or rejecting it. Two things happen inside that window. A latency buffer absorbs the time the request spent in transit; a price check compares the market at the moment of receipt against the quote, and rejects the trade if the market has moved beyond a defined tolerance. The window is short — measured in milliseconds — and the FX Global Code (Principle 17) requires that its use be disclosed, that it function solely as a risk control, and that client information not be used for trading during it. The practice is legitimate: without it, a provider streaming a price to hundreds of counterparties over uneven network paths would be writing free options against its own quote. The question is never whether a provider applies last look. It is how, and on which side.
The Asymmetry That Matters
A headline reject rate is close to meaningless. What matters is the conditional reject rate: the probability of rejection given the direction the market moved between the request and the check. A provider that rejects at a similar rate whether the move went for or against it is doing exactly what the mechanism exists to do — controlling latency risk symmetrically. A provider whose rejections cluster precisely on the moves that would have been profitable for the client is not managing risk; it is exercising a free option, and charging nothing for it. The cost of that option does not appear in the spread. It appears in the difference between the price at which a rejected order was requested and the price at which it was finally filled somewhere else — the true, and usually unmeasured, cost of a rejection.
Skew, Not Spread
The second concealment is in the shape of the price. A desk carrying unwanted inventory rarely widens both sides; it skews — shading the side that would deepen the position while quoting competitively on the side that would relieve it. To an aggregated feed the spread looks normal. To a client who consistently trades one direction — a corporate hedger, a systematic strategy with a persistent bias — the skew is a permanent, invisible tax paid on every fill. Spread is what a provider advertises. Skew is what it charges.
The Price of Your Own Flow
Pricing in these markets is endogenous. Every serious provider measures the behavior of each client’s flow after the fill and tiers its pricing accordingly: flow that consistently moves against the provider immediately after execution is priced wider, rejected more often, or declined altogether. This is why two clients receive materially different prices from the same provider on the same instrument, and why an institution cannot negotiate its way to better execution without first understanding what its own flow looks like from the other side of the quote.
Exhibit V — The Last-Look Window and the Asymmetry Test
Measuring Execution — The Discipline of Transaction-Cost Analysis
A liquidity relationship that is not measured cannot be negotiated. Transaction-cost analysis (TCA) is the apparatus through which an institution converts a provider’s marketing claims into a series of observable facts — and it is the single most effective instrument of counterparty discipline available to any participant below the apex.
The Mark-Out — The One Metric Both Sides Watch
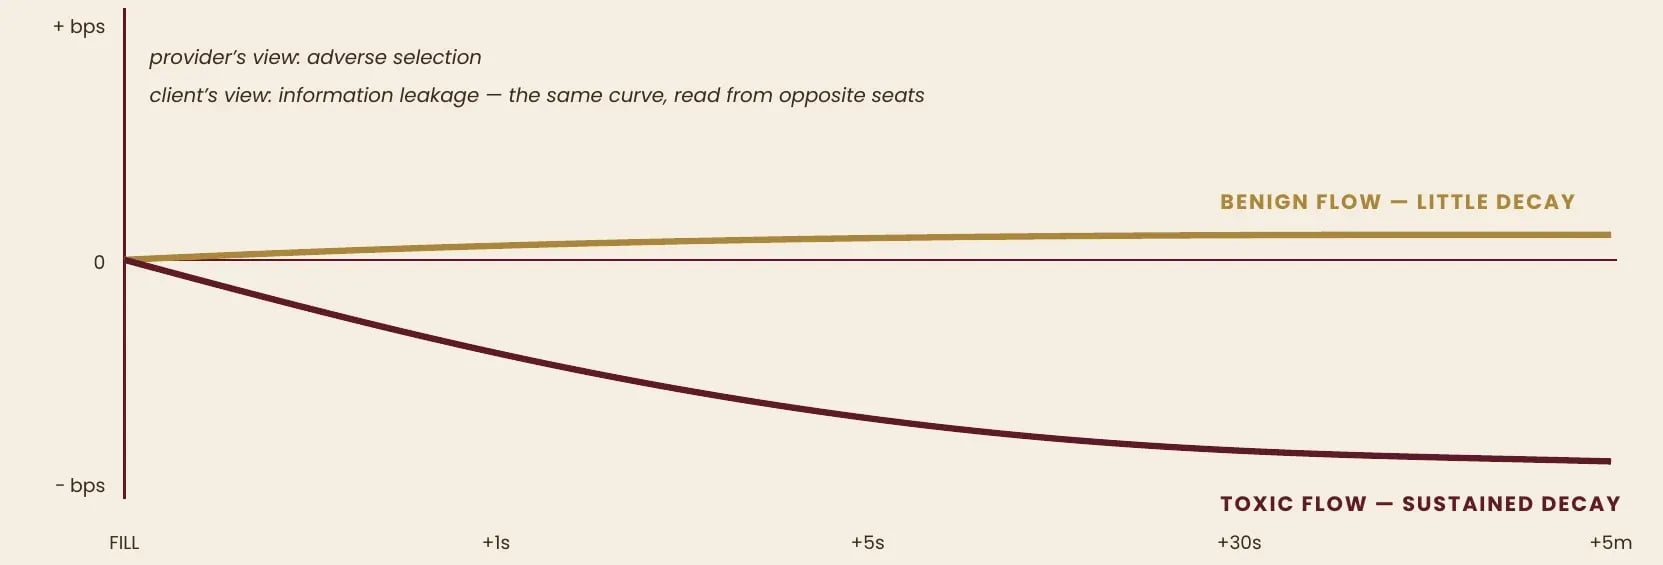
The mark-out is the movement of the mid price after a fill, measured at fixed horizons — one second, five seconds, thirty seconds, five minutes — relative to the price at which the trade was executed. Read from the provider’s seat it measures adverse selection: how much the market moved against the position it was just handed. Read from the client’s seat, the same curve measures information leakage and the true cost of the fill: a price that looked competitive at execution and decays steadily against the client over the following seconds was never competitive at all. It is the only metric visible to both sides of a quote, and the only one that cannot be dressed by a marketing deck.
Exhibit VI — The Mark-Out Curve, Read from Both Sides
The Metric Set
Around the mark-out sit five further measures, and an institution that monitors fewer than all six is not monitoring its counterparty. Effective spread — the realized cost against the mid at the moment of the request — is compared to the quoted spread, and any persistent gap between them is the relationship’s hidden price. Fill ratio and conditional reject rate are read together, never apart. Latency is judged by the variance of its round trip rather than its mean, because a provider’s worst percentile is where its rejections live. Slippage symmetry asks whether positive slippage is passed to the client with the same discipline as negative slippage — a provider that absorbs the upside and passes the downside has told you what it is. And rejection cost — the price move between a rejected request and its eventual fill elsewhere — converts the reject rate from a statistic into a number in the profit and loss.
The Discipline — When, Against What, and For How Long
TCA is only as good as the benchmark and the window it is run against. Three rules govern its use. It must be measured against an independent reference price — a consolidated feed the provider does not control — because a provider benchmarked against its own quote will always appear excellent. It must be run across a monitored trial period rather than a marketing sample, and long enough to include at least one genuinely volatile session, since a calm month tells an institution nothing about the relationship it will actually depend upon. And it must be conducted continuously rather than at onboarding: pricing in these markets is dynamic, and a relationship that was competitive at signature can decay quietly for a year before anyone notices. An institution that measures its providers this way is, in practice, a different class of client — and is priced as one.
A provider’s quality is not what it quotes. It is the distribution of what it does with your order once you have accepted the quote.
Risk & Macro — Where the Taxonomy Meets the System
Liquidity Spirals & Systemic Risk
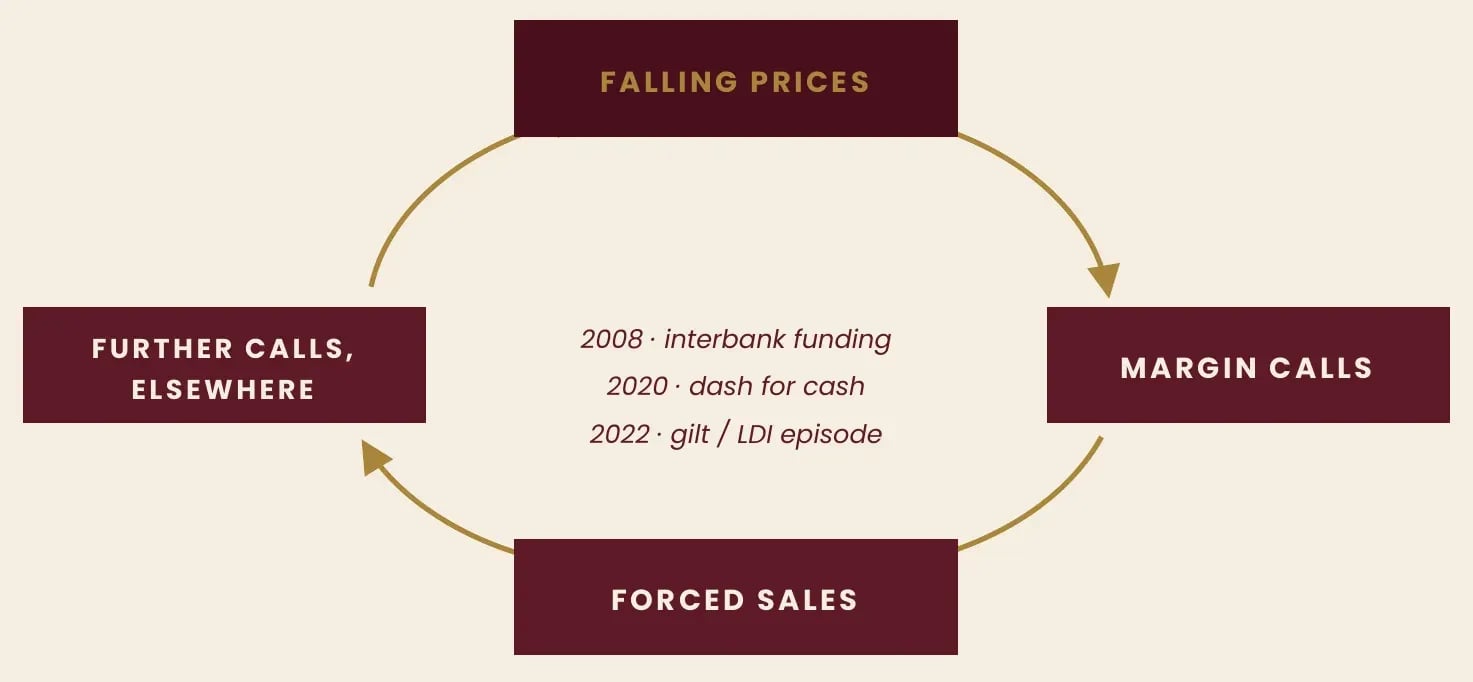
The taxonomy above describes liquidity in normal conditions. Under stress, the boundaries between sectors and provider types collapse into a single, self-reinforcing loop: falling prices trigger margin calls; margin calls force sales; forced sales push prices lower still, triggering further calls elsewhere. The 2008 crisis demonstrated the mechanism at the level of the banking system itself, as counterparty doubt froze the interbank funding markets that Tier-1 liquidity depends upon. The March 2020 “dash for cash” showed a faster version, as even U.S. Treasuries — the deepest instrument in the world — briefly became difficult to trade at a stable price while every class of participant sought cash at once. In each case the failure did not originate in one sector; it originated in the connections between them, carried by the leveraged positions and credit lines that ordinarily make the system function.
The Three Channels of Propagation
Stress does not travel between institutions by sentiment; it travels through three specific conduits. The balance-sheet channel: a loss forces a provider to reduce gross exposure, and the liquidity it was supplying disappears with it. The funding channel: a provider that cannot roll its own short-term financing cannot fund inventory, and stops quoting size regardless of its view. The collateral channel: a haircut increase or a valuation move raises the margin required against unchanged positions, forcing sales that are unrelated to any judgment about value. An institution mapping its own exposure to a liquidity event should map it along these three, not along the sector its assets happen to sit in.
A taxonomy is a map of calm markets. Stress redraws it along the credit lines, not the sector lines.
Exhibit VII — The Liquidity Spiral
The Illiquidity Trap
Private market managers face a structural version of this same tension in ordinary times, not just in crisis. Holding illiquid, higher-yielding assets — private credit, direct real estate, infrastructure — improves long-run returns but leaves a fund with limited capacity to meet redemptions or capital calls on short notice. The discipline of managing this trade-off — matching the liquidity profile of a fund’s liabilities to the liquidity profile of its assets — is one of the more consequential and least visible skills in institutional asset management, and its failure is a recurring theme behind fund gatings and suspensions in periods of market stress.
Regulatory Impact
The post-2008 regulatory architecture was built substantially around this same lesson. Basel III, and its subsequent refinement under Basel IV, introduced the Liquidity Coverage Ratio (LCR), requiring banks to hold enough high-quality liquid assets to survive a thirty-day stress scenario without external funding, alongside the Net Stable Funding Ratio governing longer-term funding resilience. In the United States, the Dodd-Frank Act pushed a substantial share of derivatives trading onto centrally cleared venues and imposed capital surcharges that made the balance-sheet-heavy principal trading model described earlier materially more expensive — a direct cause of the shift toward agency and algorithmic liquidity provision across nearly every sector in this taxonomy.
The Technology Frontier
The next structural shift in liquidity is settlement itself. Markets have moved from T+3 to T+2 settlement over the past two decades, and the U.S. equity market’s move to T+1 in 2024 was itself a step toward a longer-term destination: T+0, or atomic settlement, in which the exchange of asset and cash occurs simultaneously and instantaneously, largely eliminating counterparty settlement risk. Digital asset markets, where blockchain settlement is already close to instantaneous, offer a working preview of what this could mean for liquidity provision more broadly — a world in which the capital currently locked up to cover the two- or three-day gap between trade and settlement is freed for other use, at the cost of removing much of the buffer that currently absorbs operational error.
Constructing a Liquidity Provider — Operational Requirements
Everything above describes liquidity as it is found. What follows is what is required to become a source of it — the sequence an institution must execute, in order, to stand credibly inside the taxonomy rather than merely purchase access to it.
I. Regulatory Licensing & Jurisdictional Architecture
Secure authorization as a market maker or investment firm from a credible regulator (FCA, CySEC, DFSA, ASIC, or equivalent), with the license class determined by who the entity intends to serve — banks, brokers, and institutional end clients each sit under a different regulatory perimeter.
II. Bank Credit Lines & Prime Brokerage Agreements
Maintain PB agreements with at least two Tier-1 banks — one active, one standing backup — since a single-PB structure is exposed the moment that relationship is repriced or withdrawn. Technical onboarding (credit review, aggregation setup, give-up connection such as Traiana Harmony) runs 2–6 months per relationship, with legal and credit documentation often taking as long again — under-budgeting this is the most common reason new entrants miss their own launch date.
III. Pricing & Risk Infrastructure
Build or license a genuine pricing and risk engine — not a simple bridge — capable of composite price construction, real-time net exposure calculation, and automated hedging. oneZero, PrimeXM, and Centroid remain the reference technology stack for this layer.
IV. Book Management Policy
Define, in writing, which flow passes to market as A-Book and which is retained as B-Book, with explicit risk limits per instrument and per client — this policy, not the marketing material, determines the entity’s true risk profile. Segmentation rests on observable signals: deposit size, leverage utilization, stop-loss usage, and realized frequency. A mature hybrid book commonly internalizes on the order of 50–60% of retail flow, with win rates rising markedly above roughly $10,000 of account equity — house estimates, offered as a calibration starting point against actual client-mix data, not as measured statistics.
V. Capital & Margin Provisioning
Hold sufficient capital to post margin with every upstream counterparty; an interrupted margin call is the fastest way a well-run operation loses its credit line. The regulatory floor alone is substantial — FCA and CySEC dealer licenses carry own-funds requirements near €730,000; a US RFED registration requires roughly $20 million adjusted net capital — and this sits below, not instead of, the working capital a Tier-1 bank separately requires as posted margin. Margin percentages are individually negotiated and undisclosed, which is why a buffer well above the regulatory minimum is what preserves a credit line under a call.
VI. Multi-Source Liquidity Architecture
Avoid dependency on a single bank or single Prime-of-Prime relationship. A resilient pool is, by construction, a blended pool drawing on several independent upstream sources, so the withdrawal of any one does not interrupt pricing.
VII. Compliance & Reporting
Implement AML/KYC systems and transaction reporting calibrated to the applicable regime — EMIR and MiFID II obligations apply in full to any entity providing liquidity into the European market.
VIII. Downstream Service-Level Commitments
Define, contractually and explicitly, the service level extended to downstream clients — quoted depth, execution latency, maximum permitted slippage, and the stated handling policy during high-volatility news events.
Selecting a Liquidity Provider — A Due-Diligence Framework
The taxonomy above assumes liquidity sourcing works efficiently. In practice, the quality of a single relationship — the specific LP an institution chooses to stand behind its pricing — is what determines whether that assumption holds under stress. A retail brokerage sourcing execution, an asset manager sourcing FX hedges, a bank sourcing interbank credit lines, a hedge fund sourcing prime brokerage financing, and a Prime-of-Prime sourcing its own upstream bank liquidity are all, at bottom, asking the same question of a counterparty: will this quote still be honored when honoring it is costly? The weighting of the criteria below shifts by institution type, but the criteria themselves do not.
Exhibit VIII — The Ten Criteria of Counterparty Verification
What to actually verify — Source: Table 2 — Core due-diligence criteria for selecting a liquidity provider, applicable across institution types.
- Regulatory standingVerify license class directly with the regulator; confirm the license actually permits the activity claimed (market making vs. mere brokerage).
- Capital adequacyRequest audited financials or regulatory capital disclosure; undercapitalization relative to warehoused exposure is counterparty risk, not liquidity.
- Upstream chainA genuine LP can name and evidence its own Tier-1 or Tier-2 relationships. Inability to answer this is diagnostic on its own.
- Pricing methodologyDisclosure of last-look hold time and reject rate under both calm and volatile conditions.
- Execution qualityHistorical slippage, fill ratio, and latency data — tested against real trades, not marketing claims.
- Technology & connectivityFIX API vs. proprietary bridge; raw vs. aggregated feed; compatibility with existing OMS/EMS.
- Credit & margin termsNegotiability of margin, treatment during a margin call, netting terms, and the contractual position if the LP itself suffers a credit event.
- Business-model transparencyExplicit A-Book / B-Book disclosure — whether quoted liquidity is genuine risk transfer or an internally warehoused position.
- Stress survivorshipEvidence of behavior during a named historical stress event, not performance in calm markets.
- Exit & offboarding termsNotice period, treatment of open positions, and the wind-down protocol if the relationship is terminated.
The Weighting Differs by Seat in the Chain
A retail execution broker should weight book-management transparency and reject-rate disclosure most heavily, since its own client-facing pricing quality depends on them directly. An asset manager hedging corporate or fund exposure should weight credit terms and ISDA/CSA documentation most heavily, since the hedge exists to remove risk, not to introduce a new counterparty exposure of comparable size. A hedge fund should weight prime brokerage financing terms and the wind-down protocol most heavily, since PB relationships are typically its single largest point of counterparty concentration. A bank extending lines to smaller counterparties should weight the counterparty’s own downstream book-management policy most heavily, since that policy determines whether the flow reaching the bank is genuine hedging demand or a proxy for the counterparty’s own retained risk. A Prime-of-Prime should weight the depth and diversity of its own upstream bank panel most heavily, since a PoP with a single Tier-1 relationship is, structurally, only one repricing decision away from being unable to serve its own downstream clients.
No single criterion is sufficient on its own, and none should be taken on the provider’s own representation. Regulatory status can be verified independently through the regulator’s public register; capital adequacy through audited filings or, where public disclosure does not exist, through a direct request as a condition of onboarding; execution quality through a monitored trial period rather than a marketing deck. An institution that resists independent verification of any one of these ten criteria has, in that resistance, already supplied most of the answer.
The False Claim of “Liquidity Provider” Status
A specific misrepresentation recurs often enough in the retail brokerage segment to warrant its own treatment: the broker that markets itself as “our own liquidity provider,” or claims “bank-grade” or “institutional-grade” liquidity, without occupying any verifiable position in the tiered structure set out in Section I. This is not a matter of marketing tone — it is a factual claim about the entity’s role in the market, and in a meaningful share of cases the claim does not survive scrutiny.
A genuine liquidity provider commits its own capital to make a two-way price and stands ready to warehouse the resulting risk; by definition, this places it at Tier 3 (Prime-of-Prime) or higher in the pyramid, with a verifiable upstream credit relationship of its own. A retail broker that internalizes client flow into its own dealing desk — running a B-Book — without any offsetting hedge placed with an external counterparty is not providing liquidity in the institutional sense described in this study. It is acting as the sole counterparty to its own clients. In that structure, the client’s counterparty risk is the broker’s own solvency, in full, not a distributed chain of banks — precisely the opposite of what the term “liquidity provider” is meant to convey.
This distinction is not, by itself, a condemnation of the B-Book model — internalization is a legitimate and widely used business model, provided it is disclosed as what it is. The misrepresentation lies specifically in a broker describing an internalized, undisclosed book as “liquidity provision,” which invites a client or partner to assume a bank-backed chain of credit that does not, in fact, exist behind the quote.
Internalization is a legitimate business model. Describing it as liquidity provision is a claim about credit that does not exist.
How to Test the Claim
Names. Request the specific names of the broker’s own upstream LPs or banks. Vagueness, or a refusal framed as “proprietary,” is itself diagnostic.
Evidence. Request evidence of trade give-up or STP confirmations showing that flow actually leaves the broker’s own book and is executed in the name of an identifiable upstream counterparty.
License. Cross-check the regulatory license class against the claim. Most retail-facing investment-firm licenses (typical FCA and CySEC categories) do not authorize market-making in the interbank sense; a market-maker claim inconsistent with the license on file is a red flag on its face.
Language. Separate marketing language — “deep liquidity,” “bank-grade pricing,” “institutional execution” — from contractual commitment. Marketing language carries no obligation; only a written execution policy and SLA do.
Proportion. Ask directly what percentage of flow is internalized versus externally hedged, and at what thresholds the policy changes. A broker with a genuine hybrid book can usually answer without hesitation, because the policy is the product of a deliberate internal decision, not an improvisation.
The recommended institutional posture toward any counterparty using the term “LP” as self-description without independently verifiable upstream evidence is to treat it, for risk-pricing purposes, as a Tier-4 execution venue at best — a distribution outlet, not a source of liquidity — regardless of how the entity describes itself in its own materials.
How Providers Net, Settle, and Share Capital Among Themselves
The mechanics by which LPs actually exchange value with one another are frequently assumed, by downstream participants, to resemble a single shared pool of capital. In practice the system is a layered lattice of bilateral agreements, one shared settlement utility for FX specifically, and ordinary correspondent banking beneath both — with no single “shared treasury” in the literal sense at any point in the chain.
Bilateral Netting Under ISDA / CSA
LPs trading directly with one another do not settle every trade on a gross basis. Exposures between two counterparties are netted under an ISDA Master Agreement and its Credit Support Annex (CSA), so that only the net balance across all open positions is exchanged or collateralized at any given time. This single mechanism is what allows the interbank market to function at its actual daily turnover; settling every trade gross would require a multiple of the collateral and operational capacity the system currently uses.
Continuous Linked Settlement (CLS)
For FX specifically, CLS Bank provides payment-versus-payment (PvP) settlement among the world’s largest banks: both legs of a trade settle simultaneously, or neither settles at all, eliminating Herstatt risk — the risk that one party pays away its side of a trade and the counterparty fails before returning the other currency. Access to CLS is restricted to member banks and their direct settlement participants — one further, structural reason why Tier-1 status matters beyond commercial convenience: it is a precondition for accessing the industry’s own settlement-risk safety net.
The Settlement Record
- $7.9TSettled per day via CLS PvP · H1 2025 · +12% YoY — CLS Group, Interim Report 2025
- 96%Reduction in funding required via multilateral netting — CLS Group, CLSSettlement
- $8.7TPeak monthly average daily value · March 2025 — CLS Group, Interim Report 2025
Give-Up Netting, Correspondent Accounts & Omnibus Pools
Trades executed by a PoP or broker in the name of its prime broker are first netted across the PB’s aggregate book before the PB, in turn, nets its own resulting exposure against its Tier-1 bank relationships — a second, higher layer of netting under which a single downstream broker’s activity is rarely visible to a Tier-1 bank as anything other than a line item inside its PB’s blended flow. Actual cross-currency cash movement travels through correspondent banking, using nostro accounts (a bank’s foreign-currency account held at a correspondent abroad) and vostro accounts (the same account viewed from the correspondent’s side): there is no literal shared vault, but a dense network of bilateral cash accounts, each governed by its own credit line and netting arrangement. Within a single PB’s client base, margin posted by multiple downstream clients is often held in an omnibus collateral pool and used in aggregate to meet the PB’s own upstream margin requirement — an operational efficiency that is also a concentration risk, since the pool’s adequacy depends on the PB’s own risk management rather than on any single client’s collateral being separately protected. This is the closest the system comes to a genuinely “shared treasury,” and it exists at the level of one PB’s client base, not the market as a whole. Standard spot FX settles T+2; within that window CLS runs continuous intraday cycles, with residual gross payments completed through correspondent accounts. The industry-wide move toward T+1 and, eventually, T+0 applies here directly: the shorter the window, the less capital is required to bridge it — and the less time exists to catch an operational error before it becomes a failed settlement. Each layer of this lattice adds genuine efficiency, and each is also a node capable of transmitting stress to every other node connected to it — the liquidity spiral of Section VI, viewed from the settlement side.
Professional Conclusion
Liquidity, in this industry, is not a commodity — it is a chain of trust and credit, and the distance between any given broker and the true apex of that chain — the Tier-1 banks — is what actually determines execution quality, real spread, depth under stress, and slippage risk, regardless of what the marketing states. An operation resting on a single, undisclosed, second-tier Prime-of-Prime relationship will look indistinguishable from a well-architected one in calm markets. The difference reveals itself precisely at the moment a client needs the liquidity to actually be there. Choosing — or constructing — the correct layers of this chain is accordingly not a technical afterthought; it is an architectural decision at the level of the business model itself.
Strategic Realities
I.
No taxonomy survives contact with stress. Sector boundaries describe liquidity in calm conditions; under stress, the connections between sectors, not the sectors themselves, determine the outcome.
II.
Displayed liquidity is a claim, not a guarantee. Depth on a screen is a statement of willingness under current conditions, not a binding commitment — the gap between the two is where phantom liquidity and impermanent loss both live.
III.
Every provider has a reason to disappear. Banks retreat when balance sheet is expensive; HFT firms when volatility exceeds their models; institutions when their own leverage is tested; even AMM depositors withdraw ahead of anticipated volatility. Reliability is a property of exposure at the moment liquidity is needed, not of provider type.
IV.
Access to the apex is architecture, not accident. The distance between a participant and the deepest liquidity in any sector is a function of relationships, credit lines, and technology stack. Closing that distance is a design problem — and design problems have design solutions.
V.
Becoming a provider is a compounding commitment, not a launch event. Licensing, credit, and technology can be assembled in months; the trust that makes counterparties rely on a quote under stress is built only by holding that quote when it was costly to do so.
VI.
“Liquidity provider” is a claim about a position in a chain, not a marketing category. The right to the term is settled by verifiable upstream credit and disclosed book-management policy — never by an entity’s description of itself.
Liquidity is a chain of trust and credit. The advantage belongs to those who know every link between themselves and its apex.
Apparatus
Sources & Method
Published data. BIS Triennial Central Bank Survey (April 2025); CLS Group Interim Report (H1 2025) and CLSSettlement disclosures; Bank of England, gilt market operations (2022); Chaboud, Rime et al. on non-bank participation in EBS (2022); the FX Global Code (Principle 17, last look).
Named institutions. Cited as representative participants in their stated tier at the time of writing. Inclusion denotes market presence — not a commercial relationship with, or endorsement by, X-CHASE.
House estimates. Marked house estimate at the point of use. Drawn from X-CHASE engagement experience where no public series exists; offered as calibration starting points, not measured statistics.
Illustrative exhibits. Exhibits V and VI depict mechanisms, not observed datasets, and are labeled accordingly. Tabular exhibits are structural rather than empirical.