

THE DOCTRINE SERIES · STUDY NO. 01
The Liquidity Pyramid
On the architecture of market liquidity — the macro tide above, the microstructure below, and the long way down from the interbank floor to the retail screen.
ARCHITECTURE · DOCTRINE

STUDY NO. 01
Abstract
Liquidity has two dimensions. How much of it exists, and what it costs, is set far above the market by the central banks. How it is then shared out — tier by tier, down to the trader at the end of the line — is set by the microstructure of the market itself. This study follows both, and the currents that run between them.
Most writing on liquidity picks one lens and quietly loses the other. The macro view watches the central bank set the quantity and the price of money, and tends to treat the market as a single reservoir that fills and drains. The micro view studies the plumbing — the chain of dealers, venues, and brokers that carries a price from the interbank floor to the retail screen — and tends to treat policy as weather in the background. Each is half a picture. The pressure in the system is set above the pyramid; the path that pressure travels is set inside it.
From the micro lens comes a distinction every serious participant has to hold onto: the gap between Source Liquidity — the deep, tight, genuine market at the apex — and Derived Liquidity, the marked-up, repackaged version that is all that survives the journey to the base. From the macro lens comes the second: that the whole structure is conditional. Ease policy, and liquidity cascades down to the farthest, riskiest tiers; tighten it, and liquidity retreats back up toward cash and the apex. The depth on a screen is never a constant. It is a reading of where the cycle happens to stand.
What follows runs in seven movements: the architecture of the hierarchy (Tiers 0–5); the macro engine that sets its pressure; the two currents that circulate inside it; the way a shock at any tier reaches the others, downward and upward alike; the mechanics of the interior — credit, concealment, compression, and leverage; the strategic facts all of this imposes; and the single advantage available to anyone who can read the tide above while shortening the distance below.
Definition · The Two Lenses
Macro liquidity is the volume and price of money in the system, set by monetary policy. Micro liquidity is the depth and cost of trading at a given point in the hierarchy, set by market structure.
The first decides how much water is in the pipes; the second decides what actually reaches your tap.
Two questions decide where a participant stands in this market: which regime is running, and how far they sit from the source.
Exhibit · The Course of the Study
- The Registers of LiquidityDefinitions
- IThe Architecture of the Hierarchy
- IIThe Macro Engine — What Sets the Pressure
- IIIThe Two Currents
- IVTransmission — How the Tiers Move One Another
- VThe Mechanics of the Interior
- VIStrategic Realities
- The Swiss Franc Shock — 15 January 2015Case Study
- VIIThe Competitive Advantage
Definitions · The Registers of Liquidity
The word does more than one job. Treasury desks, risk teams, and traders each use liquidity for a different property, and being clear about which one is meant is the first discipline of the subject. Five registers are in common use.
Exhibit — The Five Registers
What it measures
- Market liquidityThe ease of trading an asset at scale without moving its price — depth, spread, and immediacy.
- Funding liquidityThe ease of raising cash against assets or in the money market — the macro tide set by the central bank.
- Accounting / corporateA firm’s capacity to meet near-term obligations out of the liquid assets on its own balance sheet.
- Operational liquidityThe working cash a firm keeps to run day-to-day settlement and obligation.
- Contingent liquidityReserves and committed lines held against stress — the liquidity kept for the day the others fail.
The scope of this study. Of the five, two concern us here — market liquidity and how it is distributed through the hierarchy, and funding liquidity, the macro engine that sets its pressure. The remaining three describe an institution’s own balance sheet rather than the market it trades in.
The Architecture of the Hierarchy
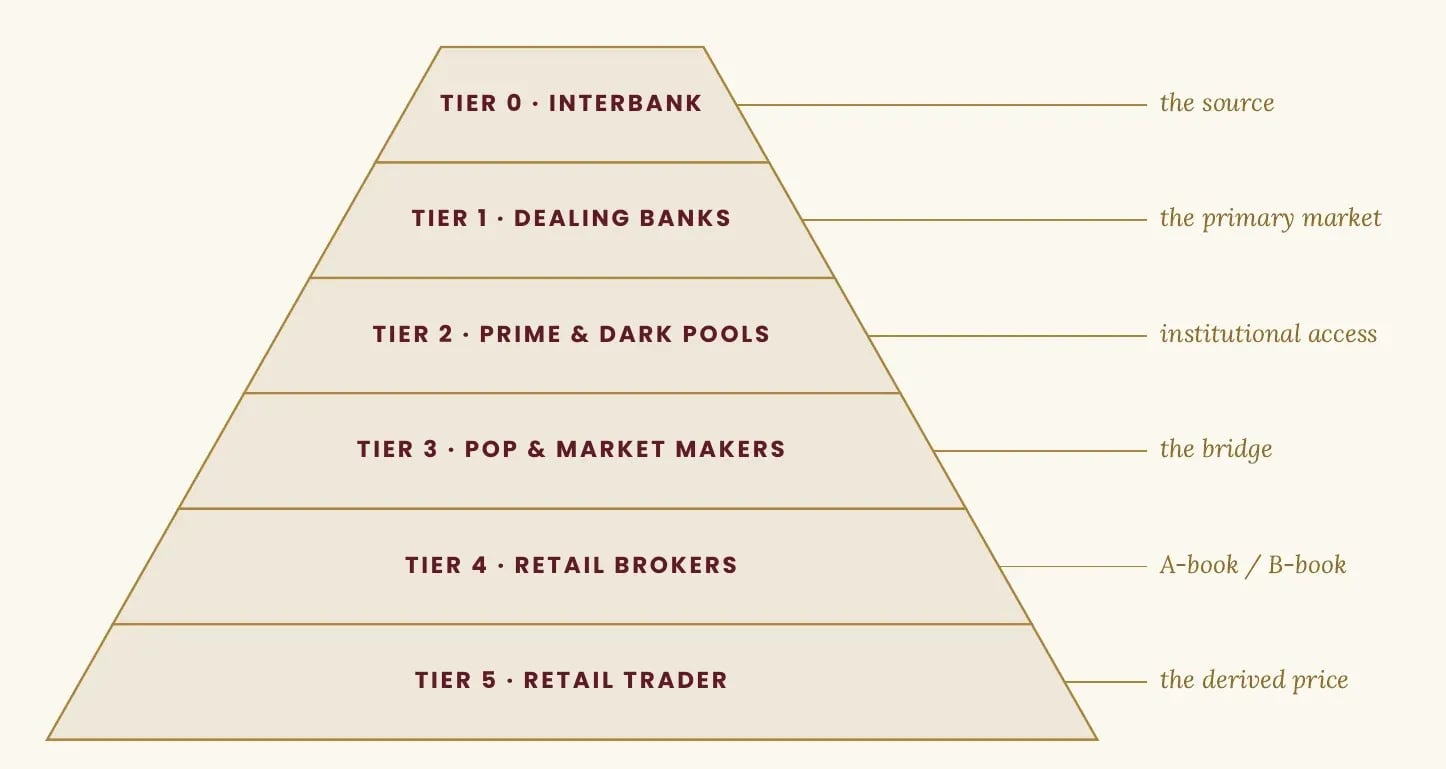
Market liquidity is arranged as a hierarchy of access. The source sits at the apex; the end consumer sits at the base. Between them runs a chain of intermediaries that hands price and liquidity downward and gathers order flow back up. Every tier answers a single question: how close does it stand to the source?
A Note on the Figure
The pyramid is read by depth and access, not by headcount. The apex holds the fewest participants and the deepest liquidity; the base holds the most participants and the thinnest individual size. Liquidity gathers where the structure narrows — and thins as it widens out toward the screen.
Tier 0 — The Apex · Central Banks & The Interbank Market
The central banks that set the price of money, and the interbank market where the largest dealing banks trade directly with one another.
This is Source Liquidity — the deepest, tightest market there is, and the point where price is genuinely discovered. Foreign exchange alone now turns over $9.6 trillion a day (BIS Triennial Survey, April 2025), with the U.S. dollar on one side of 89% of all trades and roughly 46% dealt directly between dealers. This is the water table beneath every other market.
Tier 1 — The Dealing Banks · Global Liquidity Providers
The major banks that make the primary market — among them JPMorgan, Citi, UBS, Deutsche Bank, and Barclays.
These houses quote the primary market and warehouse the most risk. A handful of them intermediate the bulk of global volume in the largest instruments; they stand one step from the source and price accordingly. The tightest spreads in the world are quoted here — to each other, and to their largest clients.
Tier 2 — Prime Brokers · ECNs & Dark Pools
Prime brokers, electronic communication networks, and dark pools.
Prime brokers extend Tier-1 access to institutional clients; ECNs pool competing quotes into a single book; dark pools let large orders execute without showing their size. Off-exchange venues now absorb 44–48% of all U.S. equity volume (FINRA, 2025–26), of which registered dark pools account for some 15–18%. This is the tier where institutions manage their footprint — an option the base of the pyramid never has.
Tier 3 — Prime-of-Prime & Non-Bank Market Makers
Prime-of-Prime firms and non-bank electronic market makers such as Citadel Securities, XTX Markets, Jump, and Virtu.
Prime-of-Prime firms repackage prime-broker access for brokers and smaller institutions that cannot reach it directly. Beside them, the non-bank market makers — technology firms trading their own capital — now supply a share of liquidity that rivals the banks; in April 2025 some $2.16 trillion a day of FX passed through prime-brokerage arrangements alone. This is the tier that wires the institutional world to the retail one.
Tier 4 — Retail Brokers · A-Book and B-Book
The retail brokers that stand between the trader and the upstream market.
Here the chain meets the public. An A-book broker passes orders through to upstream providers and earns the spread or commission; a B-book broker takes the other side, and profits when the client loses. In U.S. equities the SEC has reported that over 90% of marketable retail orders from zero-commission brokers are routed not to an exchange but to wholesalers, paid for through payment for order flow. Which book a trader is in is the single most important thing they can know about their firm.
Tier 5 — The Base · The Retail Trader
The individual trader at the end of the chain.
The end consumer of liquidity. The retail trader receives a price that has already passed through every tier above — paying the cumulative spread and markup of the whole chain — and sees only a derived quote, often a broker’s constructed feed rather than the live interbank book. Numerous but fragmented, retail sits furthest from the source, and pays the most to reach it.
Exhibit — The Hierarchy Of Access · Source To Screen
Source: X-CHASE · Office of Institutional Intelligence (House Framework).
The structure is permanent. One’s place within it is not — and the water that runs through it is poured from above.
The Macro Engine — What Sets the Pressure
The hierarchy tells us how liquidity is shared out. It says nothing about how much of it exists, or what it costs. That is settled above the pyramid altogether — by the central banks. The Federal Reserve, the European Central Bank, the Bank of Japan, and the Bank of England do not merely set an interest rate; through the supply of bank reserves they set the very quantity of money in the system. Quantitative easing manufactures reserves and floods the structure; quantitative tightening pulls them back. The apex is not only the deepest tier — it is the tap.
When the Tap Runs Dry — September 2019
The clearest proof of the mechanism is the moment it broke. By September 2019, three years of balance-sheet runoff had drained bank reserves below $1.4 trillion. On the 16th a corporate-tax deadline and a wave of Treasury settlement pulled cash out of the system at once. The benchmark secured rate — SOFR — jumped from 2.43% to 5.25% in a single day, and intraday repo prints touched 10%. The funding market at the very apex had seized. The Federal Reserve Bank of New York was forced to inject $75 billion a day to settle it, and soon went back to buying Treasuries outright. The Standing Repo Facility, set up in 2021, exists precisely so it does not happen again.
The Mechanism Is Live
None of this is history. Through late 2025, as tightening again pulled reserves down toward $2.85 trillion — under ten percent of GDP — banks leaned on the Standing Repo Facility for roughly $100 billion, secured rates pressed above the policy band, and the Federal Reserve called an end to quantitative tightening. When the apex tightens, every tier beneath it feels the pressure well before it can name the cause.
Exhibit — The Apex Seizes · SOFR, September 2019
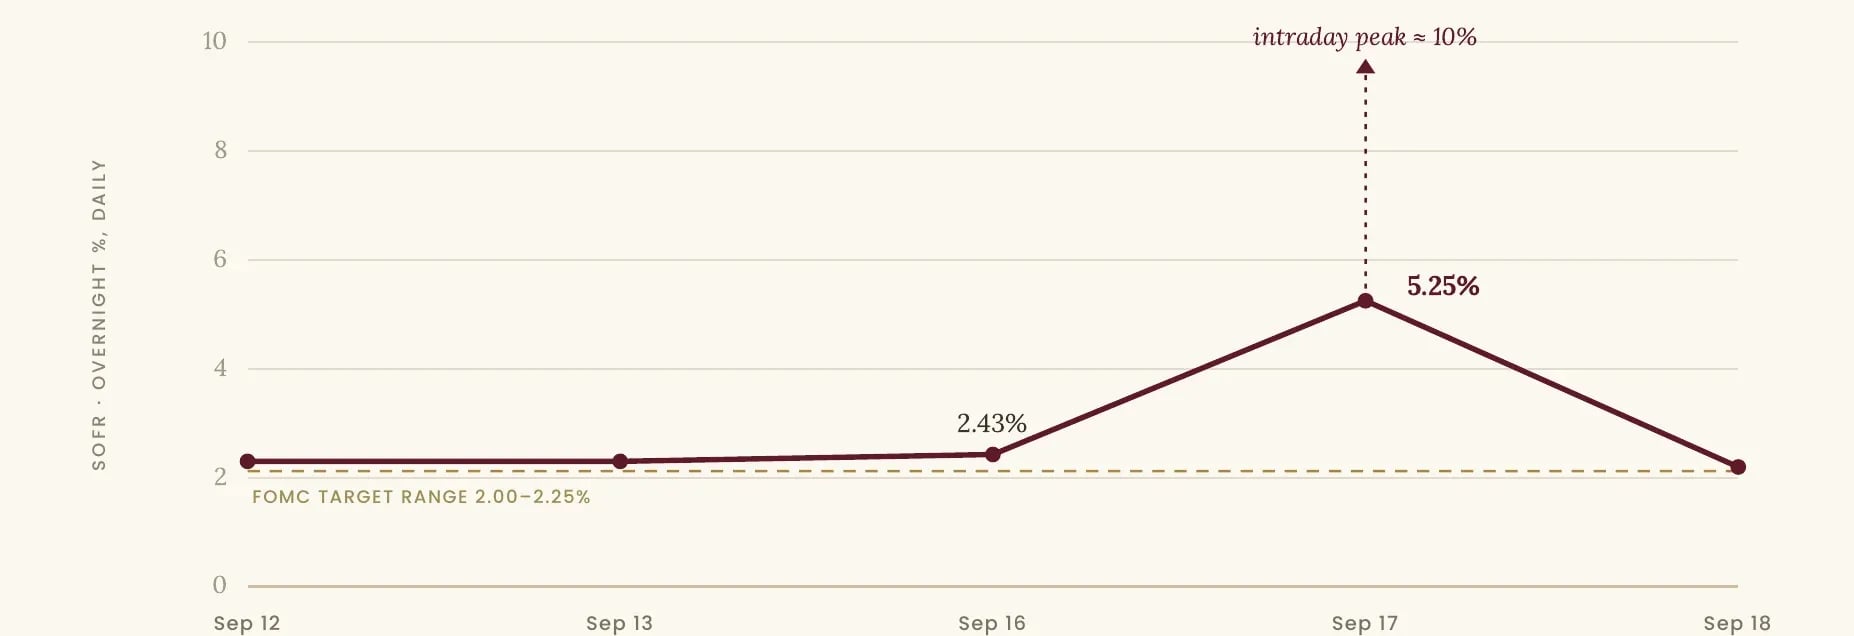
Source: Federal Reserve Bank of New York (SOFR, daily); intraday peak per U.S. OFR.
The Apex Is Global — And Denominated In Dollars
The water table is not only American; it is a dollar system. The U.S. dollar stands on one side of 89% of all FX trades, and roughly $4 trillion a day moves through FX swaps — short-term, off-balance-sheet dollar borrowing that funds the rest of the world. When dollars are plentiful that funding is cheap, and liquidity cascades outward to the farthest, riskiest tiers. When dollars turn scarce the current reverses, and it reverses hard: in March 2020 the dollar index jumped from 94 to 103 in two weeks as the world scrambled for cash, easing only once the Federal Reserve opened swap lines to other central banks and bought assets without limit.
From this comes the single most useful macro distinction an allocator can hold — the regime. Whether policy is easing or tightening decides which way the current runs through the whole pyramid, and therefore who is paid and who is exposed.
Exhibit — The Two Regimes
| Easing · QE | Tightening · QT | |
|---|---|---|
| Reserves | Abundant; the system is flooded. | Scarce; the system is drained. |
| Cost of money | Low. Cheap to fund and to lever. | High. Funding and leverage bite. |
| Volatility & spreads | Low vol; tight spreads, deep books. | High vol; wide spreads, thin depth. |
| Dominant current | Downward — the search for yield. | Upward — the flight to quality. |
| Liquidity flows to | Tiers 2–5; the far, risky edge. | Tiers 0–1; cash and the apex. |
| Who is rewarded | Leverage and distance from cash. | Cash and proximity to the source. |
Source: X-CHASE · Office of Institutional Intelligence (House Framework).
The reading. The micro hierarchy tells a participant where they stand. The macro regime tells them which way the floor is tilting. Neither is enough on its own.
The Two Currents
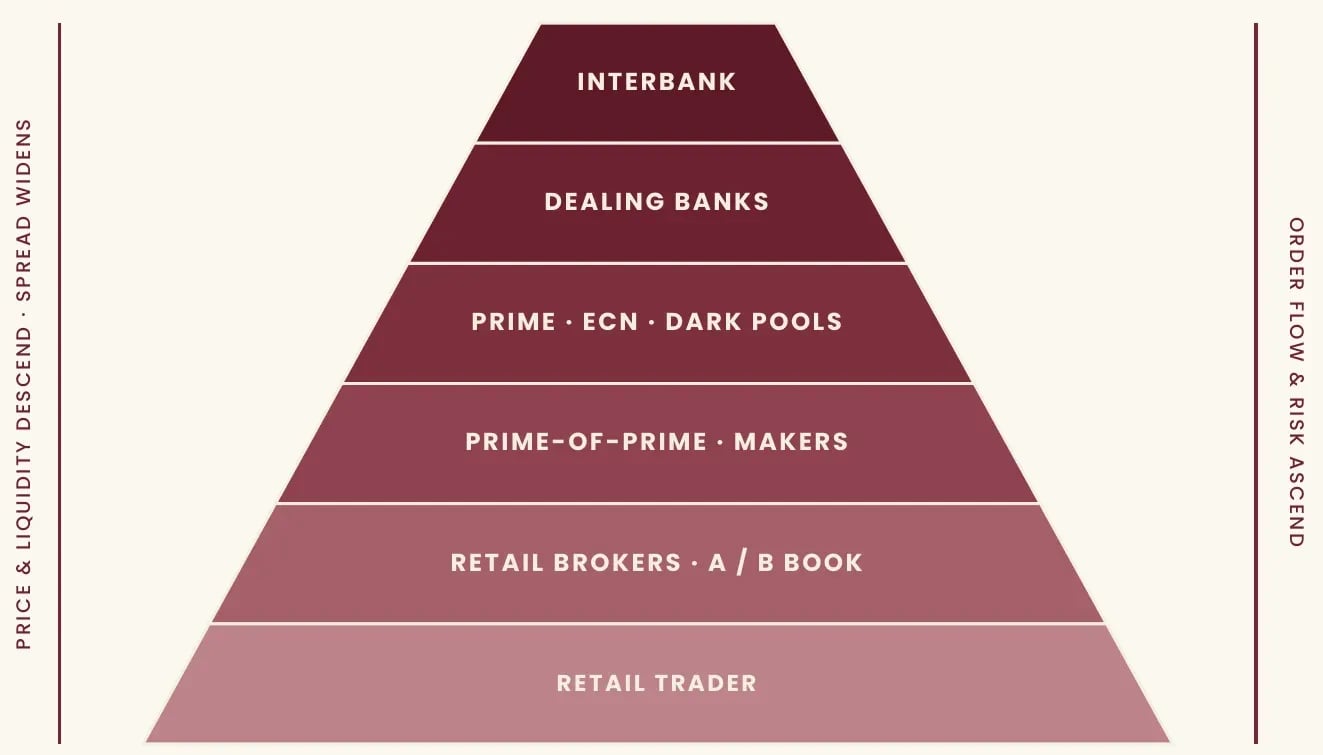
Within the hierarchy, liquidity is always moving. Two opposite currents run through the structure at all times — one carrying price and liquidity downward, the other carrying order flow back up. How strong each one is depends on the regime above; where each one runs depends on the tiers below.
The Downward Current — The Distribution Of Price
Prices are discovered at the apex and handed down. The interbank market sets a rate; the dealing banks quote it to prime brokers; prime brokers and aggregators pass it to Prime-of-Prime firms and market makers; these feed the retail brokers; and the broker shows it, at last, on the screen. At every handover a margin is added — a wider spread, a markup, a commission. The price that reaches the base is the apex price plus the toll of every gate it passed through on the way.
The Upward Current — The Aggregation Of Flow
The return current carries order flow. A single retail ticket means nothing to the market on its own; but brokers net thousands of them together, hedge the residual with upstream providers, and pass the aggregate up the chain, where Prime-of-Prime firms and prime brokers consolidate it toward the banks. Retail flow is not simply routed — it is a product. It is internalized, hedged against, and in some markets sold outright through payment for order flow. The trader at the base is, at the same moment, the consumer at the end of one current and the raw material at the start of the other.
The trader is the consumer at the end of one current — and the raw material at the start of the other.
Exhibit — The Chain Of Intermediation
| What it provides | What it adds | |
|---|---|---|
| Tier 0 · Apex — Central banks & interbank market | Source liquidity; the true price. | The benchmark. |
| Tier 1 · Banks — Global dealing banks | The primary market; deepest size. | Dealer spread. |
| Tier 2 · Prime — Prime brokers, ECNs, dark pools | Institutional access and anonymity. | Prime fees. |
| Tier 3 · Bridge — Prime-of-Prime, market makers | The connection to the retail world. | Aggregator markup. |
| Tier 4 · Broker — Retail brokers (A-book / B-book) | Market access for the public. | Spread, commission, or the other side. |
| Tier 5 · Base — The retail trader | Order flow. | Pays the sum of all above. |
Source: X-CHASE analysis (House Framework). Each tier solves one problem for the tier below it — access to the source — and charges for the service. Read the final column from top to bottom: the cost of trading is the sum of every toll between the apex and the screen.
The central fact. The retail trader pays every toll on the chain; each upstream tier pays only the tolls above it. That is the whole economics of the hierarchy in a single column — and the entire opportunity lies in compressing it.
Transmission — How the Tiers Move One Another
The macro engine and the micro hierarchy are not two systems; they are one. A change at any tier travels through the others. The current runs in both directions — and the direction tells you who is acting upon whom.
Top-Down — From The Apex To The Screen
A macro shock enters at the top and works its way down. When the central bank tightens by raising rates and draining reserves, balance sheet turns expensive for the Tier-1 dealers, and they ration it: they widen the spreads they quote and shrink the size they show. That thinner, dearer liquidity is what Tier 2 receives and hands to Tier 3, and onward. By the time it reaches the retail screen it has become wider spreads, more slippage, and — in stress — gaps where a continuous market used to be.
2022 · The Fastest Tightening In Four Decades
As the Federal Reserve raised rates at the most aggressive pace since the 1980s and ran quantitative tightening in parallel, measured depth in the U.S. Treasury market — supposedly the deepest on earth — deteriorated sharply. When the benchmark thins at the apex, the cost of moving size rises in every market quoted against it.
March 2020 · The Dollar Shortage
A scramble for cash drove the dollar index from 94 to 103 in two weeks. Even U.S. Treasuries were sold for liquidity; the upward flight reached the apex itself, and was halted only by unlimited central-bank purchases and a global network of swap lines.
In each case the impulse began at or above Tier 0, and the retail trader at Tier 5 met it last — and with the least cover.
Bottom-Up — From The Base To The Apex
The return path is less obvious and no less real. Positions built up at the lower tiers — leverage held by retail, by brokers, by non-bank funds — can, when they unwind together, force the tiers above them, and in the end the apex itself, to respond.
January 2021 · GameStop — Retail Reaches The Plumbing
A surge of retail orders (Tier 5), routed through Robinhood (Tier 4) and the wholesaler Citadel Securities (Tier 3), created settlement exposure so large that the clearing house — the NSCC, a unit of the DTCC — issued Robinhood a collateral demand of roughly $3 billion against the $696 million it held. Unable to meet it, the broker restricted buying. Retail flow had reached up and seized the plumbing.
September 2022 · The UK Gilt & LDI Crisis
A fiscal shock sent 30-year gilt yields up 140 basis points in days. Leveraged liability-driven investment funds — pension-sector vehicles in the non-bank tier — faced margin calls estimated above £70 billion and sold gilts to meet them, forcing yields higher still in a doom loop. The Bank of England was driven to the apex’s last resort: up to £65 billion of emergency purchases, and a suspension of its own tightening.
August 2024 · The Yen Carry Unwind
A Bank of Japan hike to 0.25% and a weak U.S. jobs print turned the world’s largest funding trade against its holders. Leverage funded in cheap yen unwound at once: on 5 August the Nikkei fell 12.4% — its worst day since 1987 — the VIX spiked above 60, and the S&P 500 lost 3% in a session, before the BoJ’s reassurance steadied markets within the week.
In each, the trigger sat low in — or outside — the visible hierarchy; the damage traveled upward; and the resolution needed the apex to act.
Exhibit — A Decade Of Transmission
| Direction · Trigger | Apex response | |
|---|---|---|
| Swiss franc · Jan 2015 | Top-down · Central-bank policy shock; quotes withdrawn. | None; brokers failed. |
| Repo spike · Sep 2019 | Top-down · Reserve scarcity from QT; SOFR to 5.25%. | Fed $75bn/day + T-bill buying. |
| Dash for cash · Mar 2020 | Top-down · Global dollar shortage; DXY 94→103. | Unlimited QE + swap lines. |
| GameStop · Jan 2021 | Bottom-up · Retail flow + leverage; $3bn margin call. | Clearing-house call; broker restricts. |
| Gilt / LDI · Sep 2022 | Bottom-up · Leveraged NBFI margin calls; gilt firesale. | BoE £65bn purchases; QT paused. |
| Yen carry · Aug 2024 | Bottom-up · Carry deleveraging; Nikkei −12.4%. | BoJ reassurance; hikes paused. |
Source: BIS; Federal Reserve / FRBNY; Bank of England; Bank of Japan; U.S. OFR; FINRA. Six episodes, read through the framework. Note the direction of travel — and that, in every case, the apex was the lender, buyer, or rule-maker of last resort.
The pattern. Whichever way the shock travels, it ends in the same place — the apex, acting to refill or to restrain the system. For the participant below, the lesson is symmetrical: read the regime above you, and know the soundness of every tier between you and it.
The Mechanics of the Interior
The currents show that liquidity moves; the transmission shows that a shock travels. Neither opens the machine itself — what decides how much liquidity reaches a given tier, where it hides from view, what each tier does when its margin is competed away, and why a small disturbance at the base can shake the apex. This movement opens it.
I. The Credit Gate — What Moves Liquidity Between The Tiers
A price can be quoted to anyone; liquidity cannot be extended to anyone. What governs access to the tier above is not the spread one is willing to pay but the credit someone above is willing to grant. The dealing banks extend balance sheet to the prime brokers; Prime-of-Prime firms repackage that credit for the brokers who cannot reach it directly; and the broker fronts the market for the trader at the base, who posts margin and reaches nothing on their own.
So liquidity descends along lines of credit, and the spread widens at each gate as the price of the balance sheet that carries it one tier lower. Two firms with identical capital can sit at different depths, because depth is bought with relationships, not cash. And when a line is cut, a participant is removed from the tier outright, whatever price they are willing to pay — access, at the margin, is binary. The same lines that carry price downward in calm carry exposure upward in stress.
Exhibit — The Liquidity Cascade
Source: X-CHASE · Office of Institutional Intelligence (House Framework).
II. The Unlit Interior — How Dark Pools Work
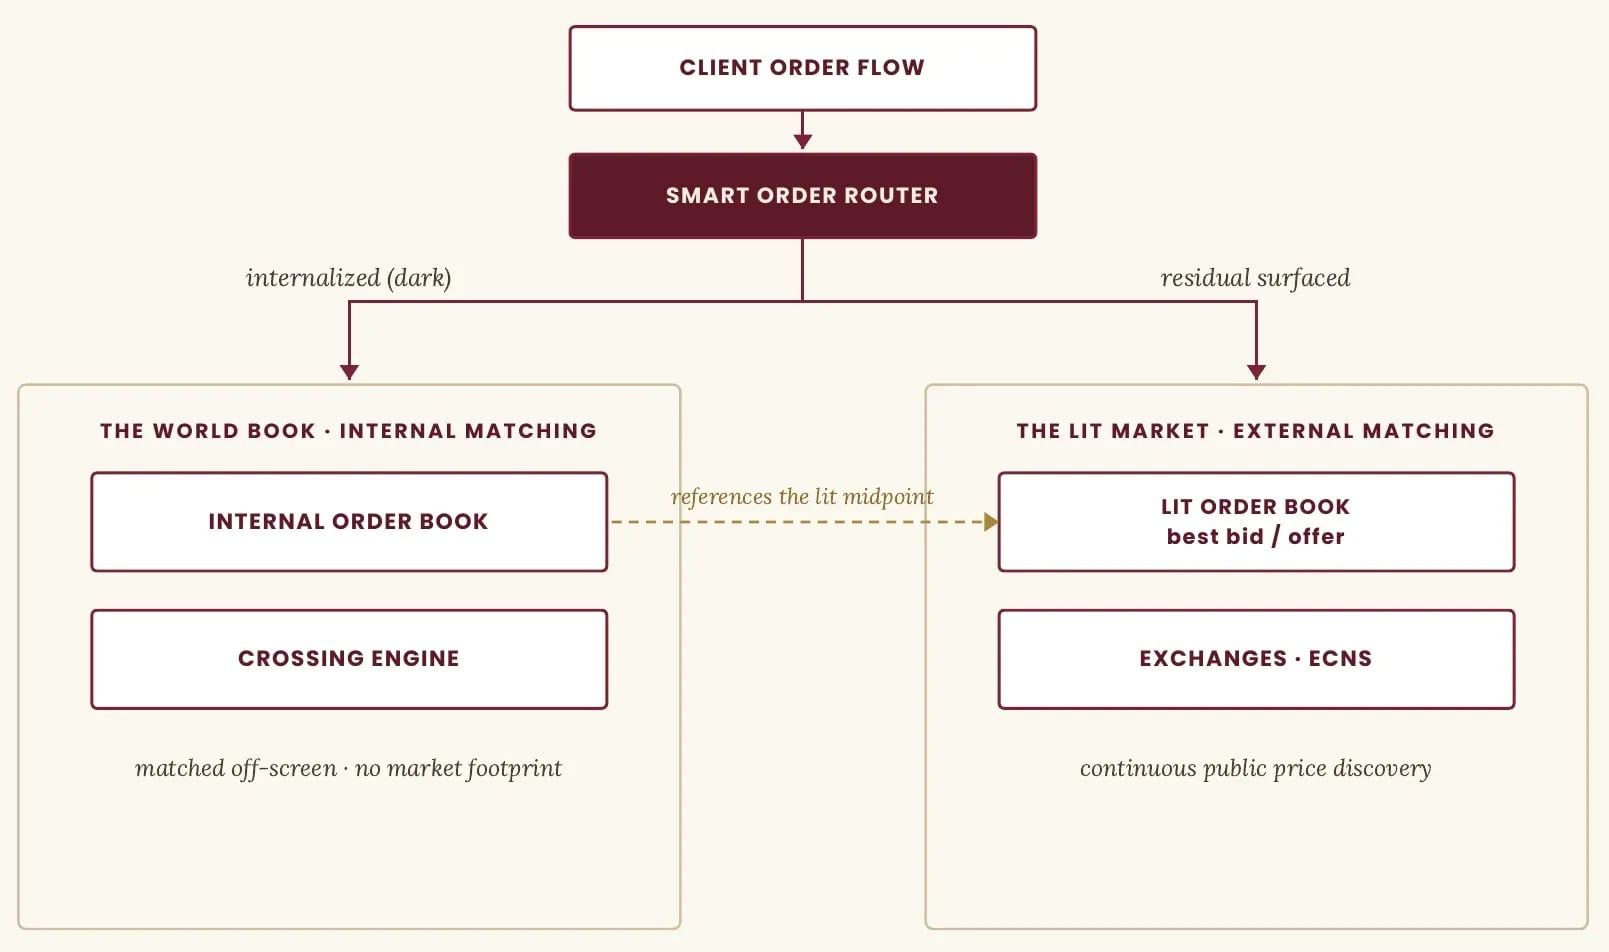
At Tier 2 sit the venues that show nothing. A dark pool is a trading venue with no pre-trade transparency: orders rest unseen, size is concealed, and a match is reported only once it is done. Its purpose is the management of footprint — the problem that size, once visible, moves the market against itself before the order can complete. By hiding the order until execution, the institution works a large position without broadcasting its intent.
Most dark venues do not discover price; they borrow it. Execution is typically referenced to the midpoint of the lit best bid and offer — so the unlit book consumes the price discovery of the lit market without contributing to it. The benefit is reduced market impact; the cost is adverse selection — strip away visibility, and the counterparty across from you may simply be faster or better informed, and the midpoint that looked like a saving becomes the entry of a loss. The discipline, then, is not access but selection: knowing which flow is safe to cross in private, and which has to be surfaced before it turns toxic. Footprint is the privilege the base never holds.
Exhibit — The World Book · Internal vs External Matching
Source: X-CHASE · Office of Institutional Intelligence (House Framework).
III. The Compression Response — Where Each Tier Turns When Spreads Collapse
When the regime above floods the system and liquidity is abundant, spreads compress and the per-unit margin at every tier thins toward zero. No tier survives compression by defending the spread; each survives by moving its economics off a rent on price and onto a rent on service.
Exhibit — The Compression Ledger
Where the margin migrates when the spread dies
- Tier 0–1 · BanksFrom spread capture to franchise volume and internalization; monetize balance sheet and skew, not the quote.
- Tier 2 · Prime / ECNs / darkFrom the trade to the infrastructure around it — prime financing, membership tiers, market data, and co-location.
- Tier 3 · PoP & makersPoP bundles the credit bridge with technology and reporting; the non-bank maker defends on speed and breadth, prunes weak pairs, and earns on volume.
- Tier 4 · BrokersThe A-book migrates to commission and volume rebate; the B-book earns from disciplined internalization — the spread captured as principal, not passed through.
- Tier 5 · The traderThe one tier with no service to sell and no one beneath to charge. Compression is the rare moment the chain works in their favor — the only response is to take it.
Compression does not flatten the pyramid; it pushes every tier off the spread and onto its underlying service — credit, technology, internalization, and data. The structure that survives abundance is the one built to earn from infrastructure rather than from the quote.
IV. The Leverage Multiplier — The Amplifier Of Flow And Shock
Leverage governs both the volume the pyramid carries and the violence with which it can fail. A unit of capital, levered, commands a far larger notional; the flow that runs down and up the structure is therefore a multiple of the real capital beneath it. In calm conditions this flatters the system — leverage deepens apparent liquidity and tightens spreads. The depth is real until it is tested. Under stress the mechanism reverses: a position that can no longer meet its margin is forced to unwind, and the forced flow strikes every tier at once. The credit lines that distributed liquidity downward now transmit loss upward — a stop-out at the base becomes a broker exposure, a Prime-of-Prime loss, and reaches the apex. Every bottom-up episode in this study — GameStop, the gilt/LDI spiral, the yen-carry unwind — was, at heart, a leveraged position unwinding through the tiers it had quietly connected. The effect is procyclical: leverage manufactures liquidity in good times and withdraws it violently in bad. This is where architecture earns its name — not to abolish leverage, but to engineer the credit limits, margin buffers, and warehousing ceilings that keep a tier-level event from becoming a system-level failure. A pyramid that distributes liquidity beautifully in calm and transmits ruin instantly in stress has not been built; it has merely been assembled. The distinction is the whole discipline.
Strategic Realities
I. Distance Is Cost
The further from the apex, the more intermediaries stand between a participant and the true price — and the more each round-trip costs. Closing that distance is the most direct improvement available to any trader, and a far more reliable one than any signal.
II. Liquidity Is Conditional On The Regime
The depth on a screen is not a constant; it is a function of where the cycle stands. The size that fills instantly in an easing regime gaps in a tightening one. To trade as though liquidity were permanent is to be the last to learn that it was only ever on loan.
III. Information Runs One Way
The top of the pyramid sees aggregated flow — who is buying, who is selling, where the size rests. The base sees only its own ticket. The asymmetry is structural; it is why “smart money” describes a position in the hierarchy as much as a level of skill.
IV. The Broker’s Book Is A Conflict
When a broker B-books, the client’s loss is the broker’s gain. That is a business model, not necessarily malpractice — but it is a conflict, and the trader who does not know which book they are in does not know whether their counterparty is for them or against them.
V. Footprint Is A Privilege Of The Top
Institutions use dark pools and worked orders to move size unseen. The retail trader has no such cover: every order is visible to the broker, and its impact is borne in full. Anonymity, like price, is something the apex enjoys and the base pays for.
Case Study · The Swiss Franc Shock — 15 January 2015
When the source goes dark, the whole chain below it discovers, all at once, what it is worth.
For three years the Swiss National Bank had capped the franc at 1.20 to the euro. On 15 January 2015, with no warning, it abandoned the floor. EUR/CHF collapsed by roughly 30% in minutes. But the headline move is not the lesson. The lesson is what happened to liquidity: at the apex, the dealing banks pulled their quotes. With no Source Liquidity, there was nothing to distribute downward; prices gapped straight through every level, and orders could not be filled anywhere near the screen.
The damage then ran down the chain in order. Retail traders were filled far beyond their stops, many into negative balances — owing more than their accounts held. The brokers who had passed those orders upward could not collect from clients as fast as their own liquidity providers demanded payment from them. The intermediary tier broke: Alpari UK entered insolvency, and FXCM, one of the largest retail brokers in the world, took losses that required an emergency rescue of around $300 million to survive.
What broke — Source: X-CHASE analysis; public disclosures (FXCM; Alpari UK).
- Tier 0–1 · BanksQuotes withdrawn; no price to make. Source liquidity vanished.
- Tier 2–3 · AggregatorsNothing to pass on; the gap cascaded downward unbroken.
- Tier 4 · BrokersClient losses exceeded balances. Alpari UK insolvent; FXCM rescued.
- Tier 5 · TradersFilled into negative balances, far beyond every stop.
The lesson through the framework. Liquidity is supplied by the tiers above, and it can withdraw without notice. When it does, a trader’s survival depends less on their position than on the soundness of the intermediary standing directly above them. The quality of the chain you trade through is not a detail. In a shock, it is everything.
The Competitive Advantage
Two questions decide a participant’s fate in this market. The macro question — which regime are we in, and which way is the current running? — and the micro question — how far do I sit from the source? The first is read above the pyramid; the second is changed within it. Mastery is holding both at once.
For the institution, that means genuine access: aggregated liquidity drawn from the top tiers, transparent routing, and an intermediary whose book does not sit against the client’s. For the broker, it means infrastructure built to an institutional standard rather than retail convenience — the difference between passing flow through honestly and merely betting against it. And for the trader, it means knowing both the tide above and the distance below, and choosing, wherever possible, to stand higher and to trade through a chain that will hold when the source goes dark.
This is the work of infrastructure. A market structured for the few can be opened, in part, to the many — not by removing the hierarchy, which is permanent, but by compressing it: fewer gates, smaller tolls, honest routing, and counterparties aligned with the client rather than against them. To move a participant one tier closer to the source — and to keep them solvent through the turn of the regime — is to change, quietly and permanently, the terms on which they trade. That is the advantage this House is built to provide.
Read the tide above. Shorten the distance below. The rest is execution.
Liquidity has a source and a tide. The advantage belongs to those who sit closest to the one, and read the other.