

THE DOCTRINE SERIES · STUDY NO. 05
The Anatomy of the Broker
On the structures of market access — what actually separates a retail book from a prime brokerage, why most of this industry’s labels are marketing, and which of these houses an owner of capital should build.
MARKET STRUCTURE · DOCTRINE

STUDY NO. 05
Abstract
A broker is not what it calls itself. It is two coordinates: how far it stands from the source, and where its profit comes from. Everything else is a consequence.
The industry that intermediates the world’s largest market has produced a vocabulary that conceals more than it describes. ECN, institutional, prime, multi-asset and direct market access are claimed far more often than they are earned, and two firms using identical language can be running opposite businesses. This study discards the vocabulary and replaces it with a structural test.
The test has two parts. The first asks where a firm stands in the hierarchy set out in Study No. 01 — how many gates separate it from Source Liquidity. The second asks a question the first cannot answer: when the client wins, does the firm win with him, or lose to him? Distance determines what a house is able to offer. The origin of its profit determines what the house is. Together they sort every brokerage structure in existence into three families, and the families do not behave alike. Those who sell access are compressed forever by technology. Those who sell risk earn the most and are legislated against continuously. Those who sell credit are the gate through which the other two must pass.
This matters beyond taxonomy, because an owner of capital entering this industry is not choosing a product. He is choosing which of the three he intends to sell, and therefore which set of pressures he will live under for the life of the firm. That choice is made once, at the beginning, and it is very nearly irreversible: the structures do not convert into one another. A retail broker does not become a Prime-of-Prime by growing. A white-label operator does not become a broker by adding clients. Each transition is a rebuild, financed at the worst possible moment, against a competitor who started there.
And the difference between these houses is not a difference of degree along one axis. It is not — as the trade press habitually implies — principally a question of liquidity. Two houses at the same tier can differ in their technology architecture, their capital structure, their licensing perimeter, their banking arrangements, their distribution machinery, their organizational shape, their risk apparatus and their terminal value, and differ in all of them at once. They are separate institutions that happen to share a front end. Section VII sets out the planes on which they actually diverge.
Definition · The Two Coordinates
Distance — how many intermediaries stand between the firm and Source Liquidity. A house one gate from the interbank floor and a house four gates from it are not competitors, whatever their marketing asserts.
Origin of profit — whether the firm earns a toll for passing risk through, or a return for holding it. This one distinction sets the capital requirement, the regulatory category, the shape of the risk department, the technology stack, and the firm’s moral position relative to its own client.
Distance sets what a house can offer. Origin of profit sets what it is.
Exhibit · The Course of the Study
- IThe Three FunctionsPart One · The Structural Test
- IIThe Two CoordinatesPart One · The Structural Test
- IIIThe Sellers of AccessPart Two · The Three Families
- IVThe Sellers of CreditPart Two · The Three Families
- VThe Sellers of RiskPart Two · The Three Families
- VIThe Houses Without ClientsPart Two · Beyond the Three Families
- VIIThe Planes of DifferencePart Three · Comparison
- VIIIThe Cost of EntryPart Four · Economics
- IXWhere the Money Actually IsPart Four · Economics
- XThe Failure ModesPart Five · Judgment
- XIThe Verdict of the HousePart Five · Judgment
- XIIThe DoctrinePart Five · Judgment
- —The Position of the HouseClosing
The Three Functions
Ask what a broker does and the ordinary answer is that it gives clients access to markets. This is true and useless. Access is a consequence, not a function.
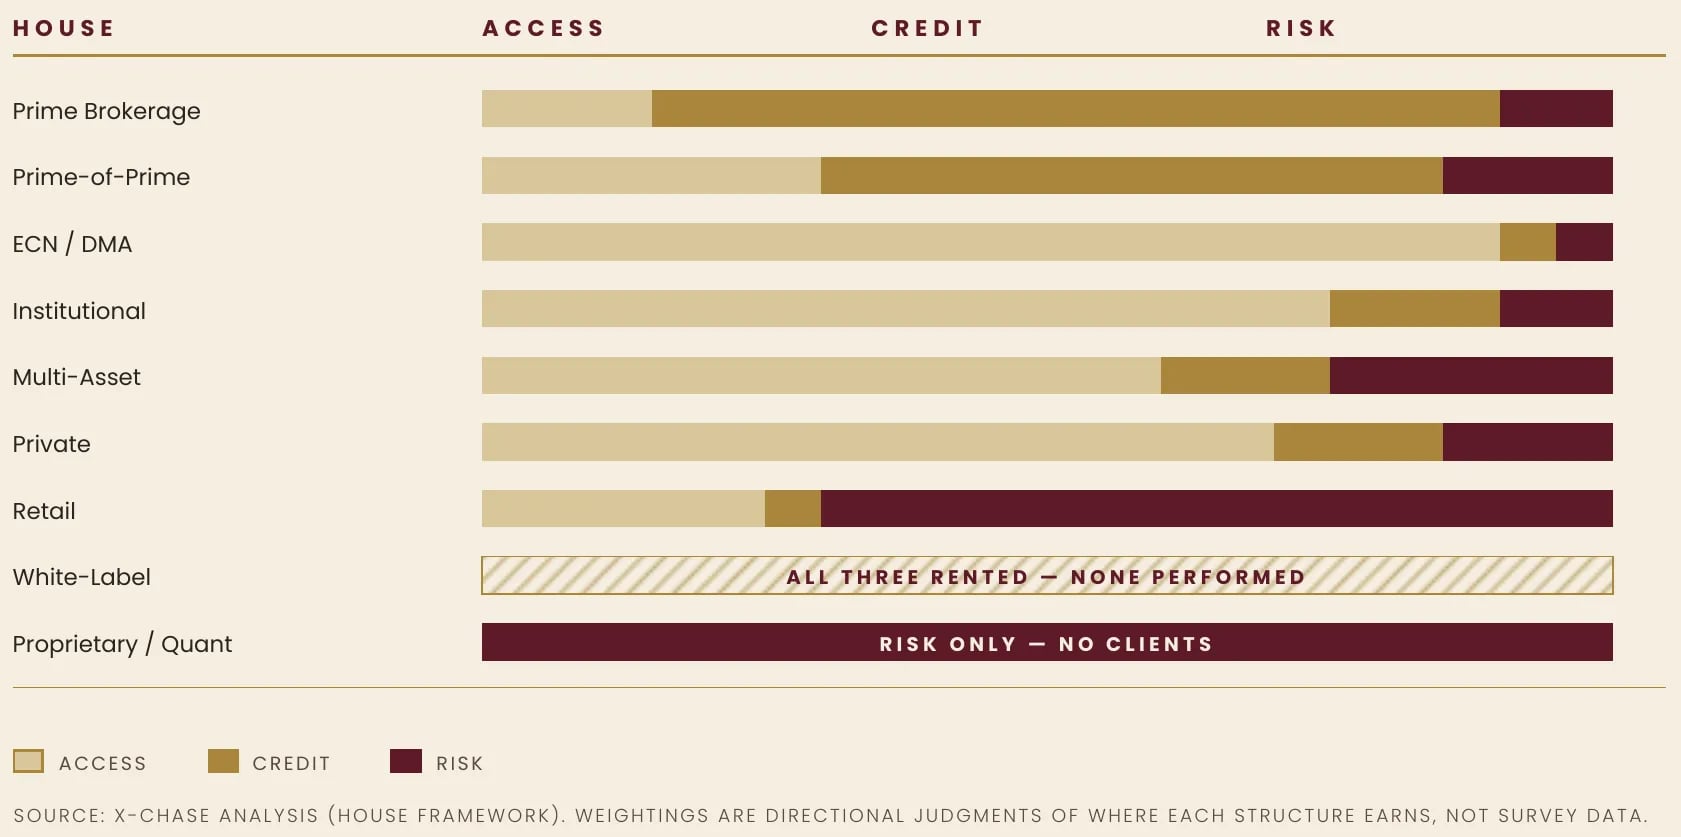
A broker performs three functions and only three. It intermediates access, because the client cannot reach the venue or the counterparty directly. It intermediates credit, because the client cannot post the collateral the upstream counterparty demands, and someone must stand between the two balance sheets. And it intermediates risk, because the instant an order arrives, someone must decide whether to pass it upstream or hold it.
Every structure examined in this study is a different weighting of those three. The retail house is heavy on risk and light on credit. The prime broker is a credit institution that happens to clear trades. The white-label operator performs none of the three and rents all of them. The proprietary firm inverts the model entirely and takes risk as its whole business, dispensing with clients altogether.
This is why the industry’s own vocabulary fails. Two firms can both describe themselves as ECN brokers, hold licenses in the same jurisdiction, and run identical front ends, while one passes ninety-five percent of its flow to seven tier-one providers and the other internalizes ninety-five percent and hedges the residual once a day. They are not two versions of one business. They are two different businesses wearing the same word.
Exhibit 1 — The Weighting of the Three Functions
The Two Coordinates
Plot the coordinates against each other and the taxonomy resolves itself without argument.
The first coordinate is the tier structure established in Study No. 01: the central banks and interbank market at Tier 0; the global dealing banks at Tier 1; prime brokers, ECNs and regulated venues at Tier 2; Prime-of-Prime firms and non-bank market makers at Tier 3; retail and mid-market brokers at Tier 4; and the end client at Tier 5. The second is the origin of profit, which has four states and only four.
The Four Origins of Profit
Agency — The firm never takes the other side. It earns commission, mark-up, or a fee for access, and its interests run with volume rather than with client outcomes.
Matched principal — Legally counterparty to both sides but holding no directional position, entering offsetting trades simultaneously. Economically agency; legally principal — and the distinction is not cosmetic, because it sets the capital requirement.
Principal — The firm takes the other side of client flow and holds the resulting position. Its profit is the mirror image of its clients’ aggregate profit, net of whatever it chooses to hedge.
Proprietary — The firm has no clients. It trades its own capital, for its own account, and the entire client-facing apparatus of the industry — marketing, support, retention, onboarding — simply does not exist.
Distance is a statement about capability: it determines what a house is physically able to offer, at what cost, and with what dependency. Origin of profit is a statement about interest: it determines whose side the house is on when the position moves. A firm can improve its distance with capital and relationships. It cannot improve its origin of profit without becoming a different business.
Exhibit 2 — The Classification Grid
| Tier · Origin of profit · What it sells | Structural condition | |
|---|---|---|
| Prime Brokerage | Tier 2 · Agency + financing · Sells credit | Closed tier; bank business |
| Prime-of-Prime | Tier 3 · Matched principal · Sells credit | The gate; hardest to earn |
| ECN / DMA | Tier 2–3 · Agency · Sells access | Compressed by technology |
| Institutional Brokerage | Tier 3–4 · Agency / matched · Sells access | Concentration risk |
| Multi-Asset Brokerage | Tier 3–4 · Mixed · Sells access (breadth) | Infrastructure-heavy |
| Private Brokerage | Tier 3–4 · Agency / matched · Sells access (trusted) | Refuses the conflict |
| Retail Brokerage | Tier 4 · Principal (hybrid) · Sells risk | Permanent conduct exposure |
| White-Label Brokerage | Tier 4–5 · Rented · Sells access (borrowed) | Dependency, not capital |
| Proprietary Trading | Tier varies · Proprietary · Sells risk (its own) | No clients |
| Quantitative Trading | Tier 1–3 · Proprietary · Sells risk (its own) | Is the liquidity |
Source: X-CHASE analysis (House Framework).
Read the grid and one fact rises immediately off it. The houses that sit highest are the ones that sell credit; the houses that sit lowest are the ones that sell risk. Distance from the source is, in the end, distance from a balance sheet.
Exhibit 3 — The Map of the Industry
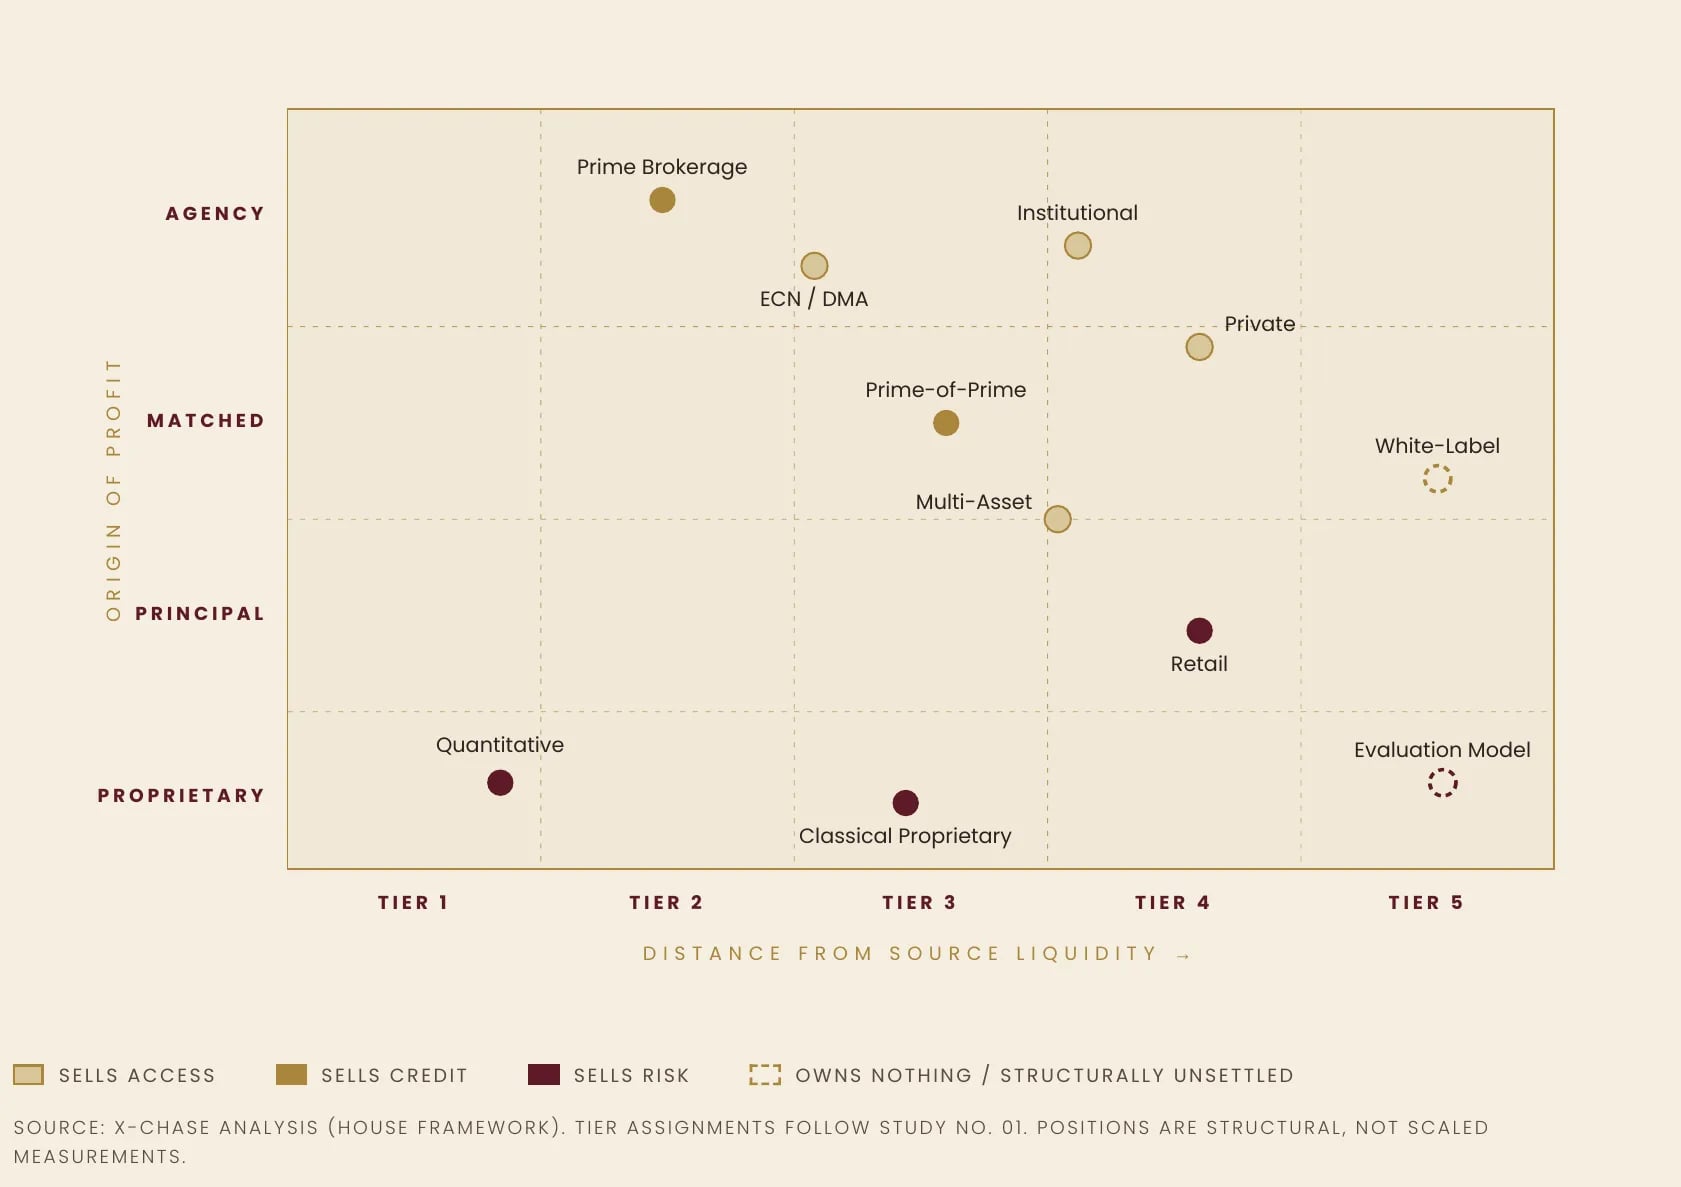
Read the map from the top-left corner outwards. The houses nearest the origin are those that stand closest to Source Liquidity and take no position against their clients; they are the smallest population in the industry and the hardest to enter. The houses in the lower right are the most numerous, the fastest to establish, and the ones whose revenue is the mirror image of their own clients’ losses. Nothing in the industry’s marketing vocabulary appears anywhere on this map, because none of it describes a coordinate.
Every broker is a toll booth or a risk warehouse. Most are both, in a ratio they rarely disclose — and the ratio is the firm.
A Note on Reading This Study
Sections III to VI describe the houses. Section VII compares them across the seven planes on which they genuinely differ. Section VIII prices entry; Section IX examines where the money actually is; Section X sets out how these structures fail; Section XI gives the verdict of the House by band of capital, and Section XII the doctrine that follows.
The four sections that follow take the three families in turn — access, credit, risk — and then the two structures that have no clients at all. The purpose is to establish, before any question of capital or jurisdiction arises, what each of these houses is actually being asked to be.
A reader with a decision to make, and limited time, may begin at Section VIII and read to the end.
The Sellers of Access
The access houses share a single economic condition: they are paid a toll for carrying a client to a market the client cannot reach alone, and the toll falls every year. Technology compresses them, competition compresses them, and their only durable defense is to sell something that is not the toll.
The ECN and Direct-Access House
This is the purest of them. Client orders interact with competing quotes from multiple providers, or reach the venue itself; the intermediary never takes the other side. Revenue is commission per lot or per million, sometimes a maker-taker rebate, sometimes a market-data line. There is no spread mark-up and no internalization — and if there is, the label is simply false.
The word ECN is the most abused in this industry, and the House treats it as a claim requiring evidence rather than a category of firm. The evidence is specific, and a principal evaluating a counterparty should ask for it in writing.
- Can the client see depth of book, or only a single quote?
- Is commission disclosed separately from spread?
- Can the firm produce symmetric slippage statistics, showing that positive and negative slippage occur in comparable proportion?
- Is the rejection and last-look policy written down and available?
A house that can answer four times is an ECN. A house that answers with a marketing page is a retail book with a different skin.
In its genuine venue form — an organized or multilateral trading facility — the regulatory burden is that of an exchange. In its far more common retail form, ECN describes a pricing model and nothing more.
The Institutional House
The institutional house sells the same access to professional counterparties rather than individuals — funds, asset managers, corporates, smaller banks, and other brokers. Commissions are measured in dollars per million rather than in pips; volumes are large and margins per unit are thin. The business is won on execution quality, credit terms, coverage and post-trade reliability, and it is never won on marketing, because the buyer is a professional who audits fill quality, slippage symmetry and rejection rates as a matter of routine.
Two consequences follow, and both are underestimated by newcomers. The first is that transaction cost analysis becomes a standing deliverable rather than a sales asset — the institutional client will measure the broker continuously and will leave on the numbers. The second is concentration: a house with forty institutional relationships can lose half its revenue when three of them go, and sales cycles measured in quarters mean the replacement will not arrive in time. The institutional house trades the retail house’s churn problem for a concentration problem, and it is not obvious which is worse.
The Multi-Asset House
The multi-asset house sells breadth: one account and one platform reaching foreign exchange, equities, futures, options, fixed income, commodities and, increasingly, digital assets. Its revenue is genuinely diversified — commission on cash equities, spread and financing on derivatives, custody and corporate-action fees, conversion on cross-currency settlement, margin lending, and interest on idle balances — and that diversification is the entire strategic argument for the model, because multi-asset revenue is far less correlated with foreign exchange volatility than single-asset revenue.
It is also where the infrastructure becomes brutal. Each asset class demands its own venue relationships, its own clearing arrangements, its own market-data licenses and its own settlement cycle. Foreign exchange settles bilaterally over a credit line; equities settle through a central counterparty; futures require clearing membership or a clearing broker; digital assets require custody infrastructure of an entirely different character and a regulatory analysis that changes annually. The core banking and wealth platforms that exist to solve this exist because assembling it is not realistic at ordinary scale. The multi-asset house is not a retail broker with more instruments. It is a different institution that happens to share a front end.
The Private House
The private house belongs in this family, and its position is instructive precisely because it is so often mistaken for a small retail broker. It occupies the same tier and offers the same instruments; it makes the opposite decision. It serves a small number of substantial principals — family offices, entrepreneurs, individuals of scale — with the service register of a private bank rather than a trading platform, and it earns almost entirely on agency or matched principal. Taking the other side of a private client’s flow is commercially available to it and strategically fatal, because the entire relationship rests on the client’s belief that the house is not his counterparty.
Everything else about the private house follows from that refusal. Its front end matters less than its reporting: consolidated multi-currency statements, performance attribution, tax-lot detail, secure communication. Its acquisition is referral rather than paid, and its client count is measured in tens rather than hundreds of thousands. Its organization is flat — coverage, execution, operations, compliance and reporting — with no retention department, no performance-marketing function and no call center. Its cost base is senior and small; its revenue per relationship is a multiple of anything achievable in retail; and its principal fragility is key-person dependency rather than regulatory intervention.
It is the only client-facing structure in this study whose economics improve when the client does well. The House regards this as the decisive fact about it, and the reason the model travels so poorly into markets where the operator’s instinct is to monetize flow.
The private house is not a small retail broker. It is a retail broker that has declined the most profitable thing it could do.
The White-Label House
The white-label house is the limiting case: a firm that operates under its own brand while renting the license, the platform, the liquidity, and often the back office of a principal broker. It earns a share of the spread or commission on the flow it introduces, on terms the principal sets. It owns a brand and a client list, and owns neither the license, the liquidity, the technology, nor the client money.
This is the correct structure for testing a market and the wrong structure for building an institution. It converts a capital problem into a dependency problem, and every material term in the arrangement can be repriced by a counterparty the operator cannot replace quickly. It also carries a regulatory trap that founders consistently misjudge: the operator may need no authorization at all if it is genuinely introducing clients to a regulated principal — or it may be conducting regulated activity without permission, depending on how it solicits, whether it holds client money, whether it exercises any discretion, and where its clients actually are. That line is jurisdiction-specific, it is enforced, and it is not cured by a disclaimer in a footer.
The Four Terms That Decide a White-Label Arrangement
Client ownership — whether the client relationship is legally the operator’s or the principal’s, and what happens to it on termination. This is settled at signature or it is never settled.
Data portability — whether the operator can extract full client records, trade history and balances in a usable form, on demand, without the principal’s consent.
Economic revision — the notice period and grounds on which the principal may reprice the revenue share, and whether the operator has any protection at all.
Migration rights — whether the operator may move the book to another principal or to its own license, and on what timetable.
All four are available before the first client is onboarded and none of them is available afterwards.
The seller of access owns the relationship and rents the machinery. The question is only how long the owner of the machinery will let him.
The Sellers of Credit
The credit houses are the reason the hierarchy exists at all. A price can be quoted to anyone; liquidity cannot be extended to anyone. What governs movement between the tiers is not the spread a participant will pay but the credit someone above is willing to grant — and the houses that grant it occupy the most defensible position in the chain.
The Prime Broker
The prime broker is a credit institution before it is anything else. It lends its name, its balance sheet and its counterparty relationships so that a client can trade with many counterparties while settling through one, with the prime broker guaranteeing settlement and substituting its own credit for the client’s. Its revenue comes from financing spreads, securities lending, margin interest, ticket fees, and the businesses that attach to a prime relationship — clearing, reporting, custody, capital introduction. Execution commission is the smallest part of it.
The prime broker does not aggregate liquidity for its client. It grants the client the right to reach it. That distinction is exact, and it is the whole business.
The tier is also, in practice, closed. Following the removal of the EUR/CHF floor in January 2015, tier-one foreign exchange prime brokers repriced and re-scoped their offering sharply; balance-sheet thresholds for onboarding were widely reported to have moved into the region of fifty million dollars, and industry research at the time recorded the average number of prime relationships held per client falling from roughly 4.8 to 2.7 over the preceding four years. Access narrowed and has not meaningfully widened since.
The business itself, meanwhile, has never been larger. The BIS Triennial Survey for April 2025 records $2.163 trillion per day of foreign exchange turnover intermediated through prime brokerage arrangements — an increase of 64.2% on 2022, against total market turnover of $9.6 trillion per day, itself up 28%. Prime brokerage grew more than twice as fast as the market it sits inside.
The House Position on Prime Brokerage
Prime brokerage is a bank business and the business of a small number of very large non-bank institutions. It is not foundable at any capital level a private investor is likely to deploy, and any proposal that suggests otherwise is describing something else and using the word for its prestige.
The Prime-of-Prime House
The Prime-of-Prime exists precisely because of that closure. It holds one or more relationships with tier-one prime brokers and repackages what it receives — credit, liquidity, clearing, reporting — for the brokers, funds and corporates that cannot meet the bank’s thresholds directly. It is the bridge between the institutional world and everything below it, and it is the single most strategically located tier in the chain.
Its product is curation. The Prime-of-Prime aggregates tier-one bank feeds and non-bank market-maker streams into one pool with a defined last-look policy, stated rejection thresholds and audited symbol coverage, and the quality of that curation is its entire competitive position. Its revenue was historically the mark-up on the aggregated feed; the better firms have deliberately migrated it onto the infrastructure instead — credit, connectivity, exposure monitoring and reporting, sold as a bundle. This is the compression response described in Study No. 01, executed at the level of business model rather than of quoted spread.
Its capital requirement is not set by the regulator. A full principal-dealing permission is the entry point — the published minima appear in the ledger at Exhibit 9 — but the binding number is the collateral the upstream prime demands, and it is a multiple of the license figure. Which is exactly why the position is defensible: the prime relationship must be earned before any revenue exists, and it cannot be purchased.
Exhibit 4 — What the Credit Gate Actually Governs
Instrument of credit · What it determines for the tier below
- 1Initial margin termsThe leverage the house can offer downstream, and therefore its entire product proposition
- 2Collateral eligibilityWhether the house’s own capital can be deployed productively or must sit idle as posted cash
- 3Intraday credit lineWhether the house survives a gap without a same-day capital call
- 4Give-up permissionsWhich venues and counterparties the house can reach at all
- 5Concentration limitsHow large a single downstream client may become before the house is refused
- 6Termination noticeHow much warning the house receives before it is removed from the tier
Source
X-CHASE analysis (House Framework). None of these terms is publicly quoted; all are negotiated, and all are revisited.
The seller of access is paid for a service. The seller of credit is paid for a permission. Only one of the two can be undercut.
The Sellers of Risk
The third family earns from holding what the other two pass on. It is the most profitable family in this industry, the most heavily regulated, and the only one whose revenue depends on its clients doing badly.
The retail house offers leveraged foreign exchange, contracts for difference, or equivalent over-the-counter exposure to individuals, at high leverage and small ticket size, acquired through paid marketing and partner networks. Its economics rest on three legs and it is a serious analytical error to reduce them to one.
- Spread mark-up and commission on flow passed upstream — the visible line, and the smallest.
- Internalized profit on flow retained — the highest-margin and highest-variance line in the industry.
- Financing — overnight swap charges, applied asymmetrically in most retail books, and interest earned on segregated client balances, which in a normalized rate environment has become a material and under-discussed source of income. Plus500 disclosed $56.7 million of interest on client funds in 2024, against $51.9 million the prior year: a stream that arrives regardless of what any client does.
The uncomfortable fact about this house is documented by its own regulators. Analyses conducted by national competent authorities across the European Union and cited by ESMA in its 2018 intervention found that between 74% and 89% of retail contract-for-difference accounts lose money, with average losses per client ranging from €1,600 to €29,000. Mandatory provider-specific disclosures published since by large regulated operators typically sit lower — commonly in the high-60s to low-70s percent — which represents genuine improvement produced by leverage caps, margin close-out rules and negative balance protection, and still describes a business in which the majority of clients lose.
The retail house is the only structure in finance whose best quarter and its clients’ worst quarter are the same quarter.
This is not, by itself, an accusation. Internalization is a legitimate risk business and someone must take the other side of a leveraged retail position; the alternative is not a fairer market but no market. What it is, unavoidably, is a conflict — and the House holds that a conflict may be run, but only if it is governed.
The Governed Form: The Hybrid Book
The governed form is the hybrid book: flow classified by profitability and behavior; internalization capped by symbol and by aggregate exposure; hedging automatic beyond defined thresholds; the whole apparatus reviewed by a risk function that does not report to the dealing desk.
A hybrid book is not a compromise between the A-book and the B-book. It is the only structure in which the firm’s risk appetite is an explicit decision rather than an accident of who happened to be on the desk that afternoon. The pure B-book, run without that apparatus, is not a business model. It is an unhedged short position on the collective good fortune of one’s own clients, and it has ended more brokerages than any market event in the record.
Exhibit 5 — The Governance Apparatus of an Internalizing Book
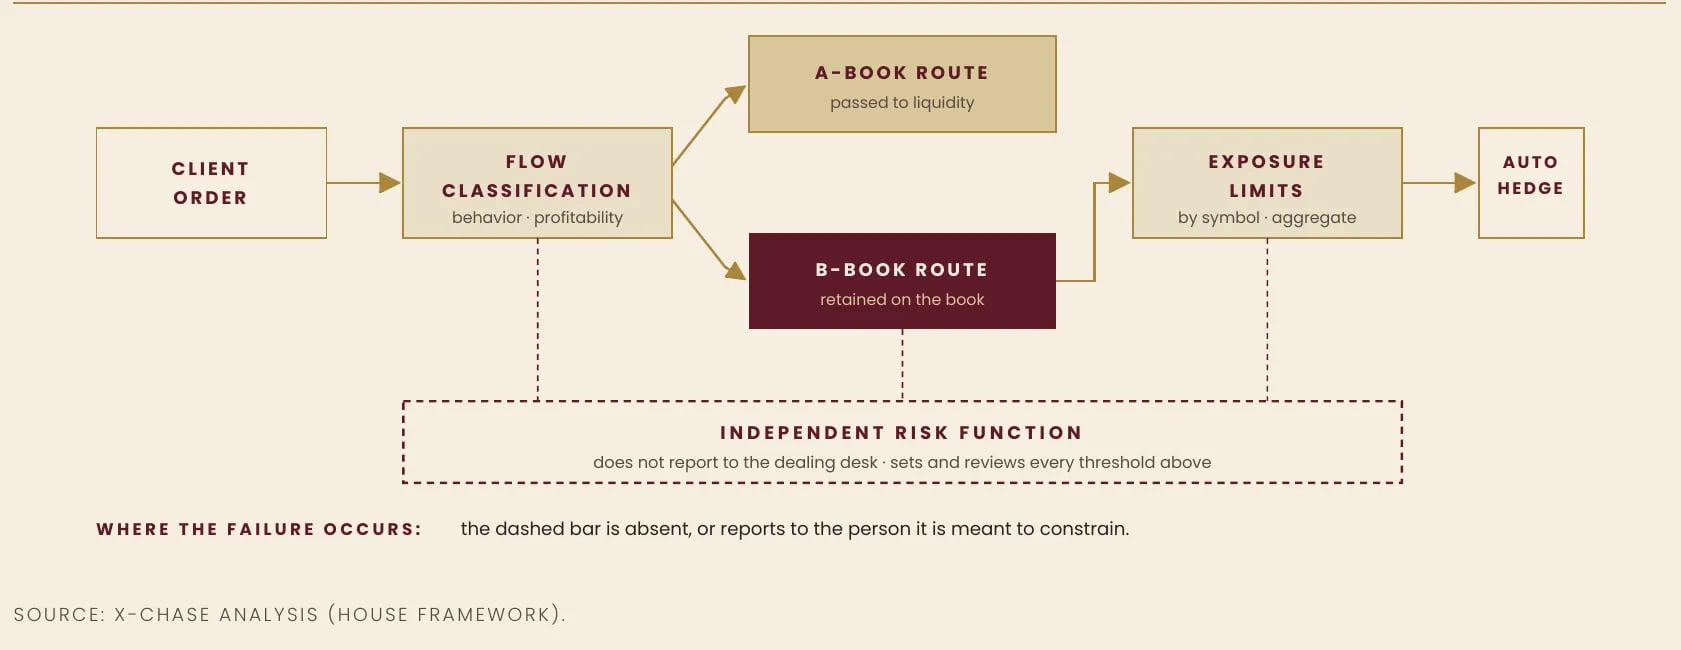
Every element of that diagram exists in some form in every serious retail operator. The distinction between a governed book and an ungoverned one is not the presence of internalization. It is whether the dashed bar at the bottom is real.
The Houses Without Clients
Two structures in the taxonomy have no clients at all, and they are routinely misfiled because one of them has borrowed the vocabulary of the other.
Classical Proprietary Trading
A firm trading its own capital, taking directional or relative-value risk, and keeping the result. There is no client money, no onboarding, no retention. In most jurisdictions trading one’s own money requires no license at all, though market access, clearing membership and any acceptance of external capital each carry their own perimeter — and the perimeter is where the analysis actually happens.
The Evaluation Model
The business that has appropriated the word prop over the last five years is a different animal wearing the same name. It sells assessment programs to individuals, funds a small fraction of those who pass, very often on simulated accounts, and shares notional profit. Its dominant revenue line is the evaluation fee, which is recurring and high-margin; the profit-share line is volatile and secondary.
The segment’s data quality is poor, and the House regards the poverty of the data as itself the finding: published market-size estimates diverge between approximately twelve and twenty billion dollars depending on what is being counted — a spread no serious allocator should accept. The verifiable figures are more useful. FTMO’s parent holding reported revenue of approximately $329 million for 2024, some 53% above the prior year, with net profit near $62.5 million and more than 2.3 million open accounts; on 1 December 2025 it completed the acquisition of OANDA from CVC, following approvals from five regulators. An evaluation firm buying a multi-jurisdictional regulated broker says more about where the segment believes its future lies than any market forecast. Against that, an FPFX Tech study of more than 300,000 accounts across ten firms found that approximately 14% of participants passed an evaluation and approximately 7% ever received a payout.
The House Position on the Evaluation Model
It is a consumer-subscription business with a trading skin. It can be run honestly and it can be extremely profitable. It should be priced as a marketing and payments company subject to sudden regulatory reclassification, not as a trading company — and its defensible form is as an acquisition channel attached to a licensed brokerage, which is precisely the direction the segment’s own leaders have taken.
Quantitative Trading
The other client-less house is the one this industry most consistently underestimates, because it is usually described as a technology curiosity when it is in fact a structural rearrangement of the top of the pyramid.
Systematic, model-driven trading of the firm’s own capital, at frequencies from microseconds to weeks, has in its market-making form become a first-order supplier of liquidity rather than a consumer of it. The displacement is documented and it is a decade old. In Euromoney’s 2016 survey — the point at which the shift became publicly visible — the combined foreign exchange market share of the top five banks had fallen to 44.7% from more than 60% two years earlier, and XTX Markets entered the top ten as the first non-bank liquidity provider to do so. The trend did not reverse; it consolidated. Non-bank electronic market makers now sit alongside the dealing banks in the pricing of major instruments, and Study No. 01 placed them at Tier 3 for structural reasons while noting that in some instruments they price like Tier 1.
The economics of these firms explain both their rise and their inaccessibility. UK filings for 2025 show XTX Markets recording combined net revenue of approximately £3.93 billion across its three principal UK operating entities and combined net profit of £1.71 billion — increases of 44% and 33% respectively on 2024 — on a global headcount of roughly 250 people, handling in the order of $250 billion of daily trading volume across some 35 countries. Citadel Securities reported record net trading revenue of approximately $12.2 billion for 2025, up 25%, with EBITDA in the region of $6.5 billion and a staff of about 1,800 serving more than 1,600 institutional clients.
These are not brokerages with better software. They are capital-and-research institutions in which technology is not a support function but the entire firm, and in which co-location, custom hardware, direct exchange feeds and a research pipeline consume most of the payroll. XTX’s research infrastructure has been reported to run to tens of thousands of graphics processors — a capital program with no analogue elsewhere in this taxonomy.
The structural cause is worth naming, because it is not primarily about speed. Post-crisis capital rules attach a cost to a bank’s balance sheet that does not attach to a non-bank principal trading firm holding the same inventory. The non-bank maker is competing against a counterparty carrying a regulatory tax it does not pay. Speed is how it wins the trade; the capital treatment is why it can afford to.
A large share of what reaches a broker’s aggregator as “bank liquidity” is priced by firms that are not banks — whose risk appetite is model-driven, and whose withdrawal in a volatility event is not a malfunction but a design.
The Planes of Difference
The houses have been described. What follows compares them — and the first thing to establish is that the comparison cannot be conducted on one axis.
The trade literature treats liquidity as the distinguishing variable, because liquidity is what vendors sell and what conferences discuss. It is a serious distortion. Liquidity is one plane of seven, and it is not the one on which most new houses fail. These structures differ in their technology architecture, their capital and licensing perimeter, their banking and payment arrangements, their organizational shape and human capital, their distribution machinery, and their terminal value — and they differ on all of them simultaneously and consequentially. A decision taken on one plane forecloses options on the other six.
This is the practical reason the structural choice cannot be deferred until after launch. An operator who selects a platform because it is familiar has already selected a client segment; an operator who selects a jurisdiction because it is quick has already selected a banking constraint; an operator who selects a liquidity provider because the spread is tight has already selected a dependency. None of these decisions announces itself as strategic at the moment it is taken.
Exhibit 6 — The Same Question, Three Structures, Seven Answers
The Retail House
- 1TechnologyLicensed platform; the differentiating build is CRM, payments and flow analytics
- 2Liquidity1–3 providers at launch, 6–12 at maturity; purchased
- 3Capital & licenseRetail permissions; conduct-driven; leverage caps bind
- 4Banking & paymentsExistential — multiple deposit rails or the firm stops
- 5OrganizationEvery function at full weight; support scales with client count
- 6DistributionPaid acquisition and partner networks; cost rises annually
- 7Terminal valueValued on regulated client base and recurring revenue quality
The Prime-of-Prime House
- 1TechnologyOwned aggregation, credit and exposure engines; the platform is the product
- 2Liquidity8–20 curated streams; the curation is what is sold
- 3Capital & licensePrincipal-dealing permission; upstream collateral is the real number
- 4Banking & paymentsInstitutional settlement only; no consumer rails
- 5OrganizationSenior, small; coverage, credit, technology, risk
- 6DistributionRelationship-led; sales cycles in quarters
- 7Terminal valueValued on relationships, credit lines and infrastructure
The Quantitative House
- 1TechnologyEntirely proprietary; research pipeline and latency infrastructure consume the payroll
- 2LiquidityNone purchased — the firm supplies it
- 3Capital & licenseOften no client-facing license at all; capital is inventory
- 4Banking & paymentsClearing and custody; no deposits
- 5OrganizationResearchers and engineers; no client-facing function exists
- 6DistributionVenue and counterparty connectivity; no distribution
- 7Terminal valueRarely sold; value is the research organization
Source
X-CHASE analysis (House Framework).
Read down any column and a coherent institution appears. Read across any row and it becomes obvious that these are not variants of one business. The sections that follow take the four planes on which the differences are most often misjudged.
Plane One — Technology and Systems Architecture
The front end is the most visible technology decision and the most misjudged, because it is treated as a product choice when it is in fact a lock-in decision. MetaTrader 4 and MetaTrader 5 remain the retail default, with cTrader, DXtrade, Match-Trader and the Devexperts family competing at the margin; the institutional house works through FIX connectivity and API with a graphical interface as a secondary offering; the prime broker has no client trading interface at all, only credit, margin and post-trade reporting; the quantitative firm builds its own and shows it to nobody.
But the front end is the shallowest layer of the stack, and concentrating on it is precisely how founders arrive at an architecture that cannot support the institution they intended. A brokerage is nine systems, not one, and the houses differ in which of the nine they own, which they integrate deeply, which they treat as replaceable, and which they do not need at all. That pattern of ownership is the technology architecture. The platform brand is a label on top of it.
Three distinctions govern the whole plane.
First, ownership versus integration. A layer that is owned is a source of differentiation and a permanent cost center. A layer that is deeply integrated from a vendor is fast to deploy and creates a dependency that is expensive to unwind. A layer treated as commodity should be selected on price and replaceability, and nothing else. Firms get into difficulty by owning what they should have rented and renting what they should have owned. A retail house that builds its own matching engine has misallocated capital; a Prime-of-Prime that licenses its aggregation logic from a third party has no product.
Second, latency is not a universal requirement. It is a requirement of specific structures. For a quantitative market maker, microseconds determine profitability and justify custom hardware, direct exchange feeds and co-location at the primary matching engines. For a Prime-of-Prime, latency determines the quality of the aggregated feed it sells and therefore its competitive position. For a retail house, the marginal value of shaving milliseconds is close to zero relative to the marginal value of a payment rail that does not fail — and capital spent on the former instead of the latter is capital destroyed. The industry’s habit of marketing latency to retail operators is a transfer of vendor margin, not an improvement in the business.
Third, the binding technology constraint is exit, not entry. Every layer that is integrated deeply enough to matter is also integrated deeply enough to be difficult to leave. The real function of a technology department in a client-facing brokerage is not to select systems. It is to preserve, at every layer, the firm’s ability to leave any single vendor within a defined period and at a defined cost — and to know what that period and cost are before the contract is signed rather than after the counterparty has repriced.
Exhibit 7 — The Technology Architecture by House
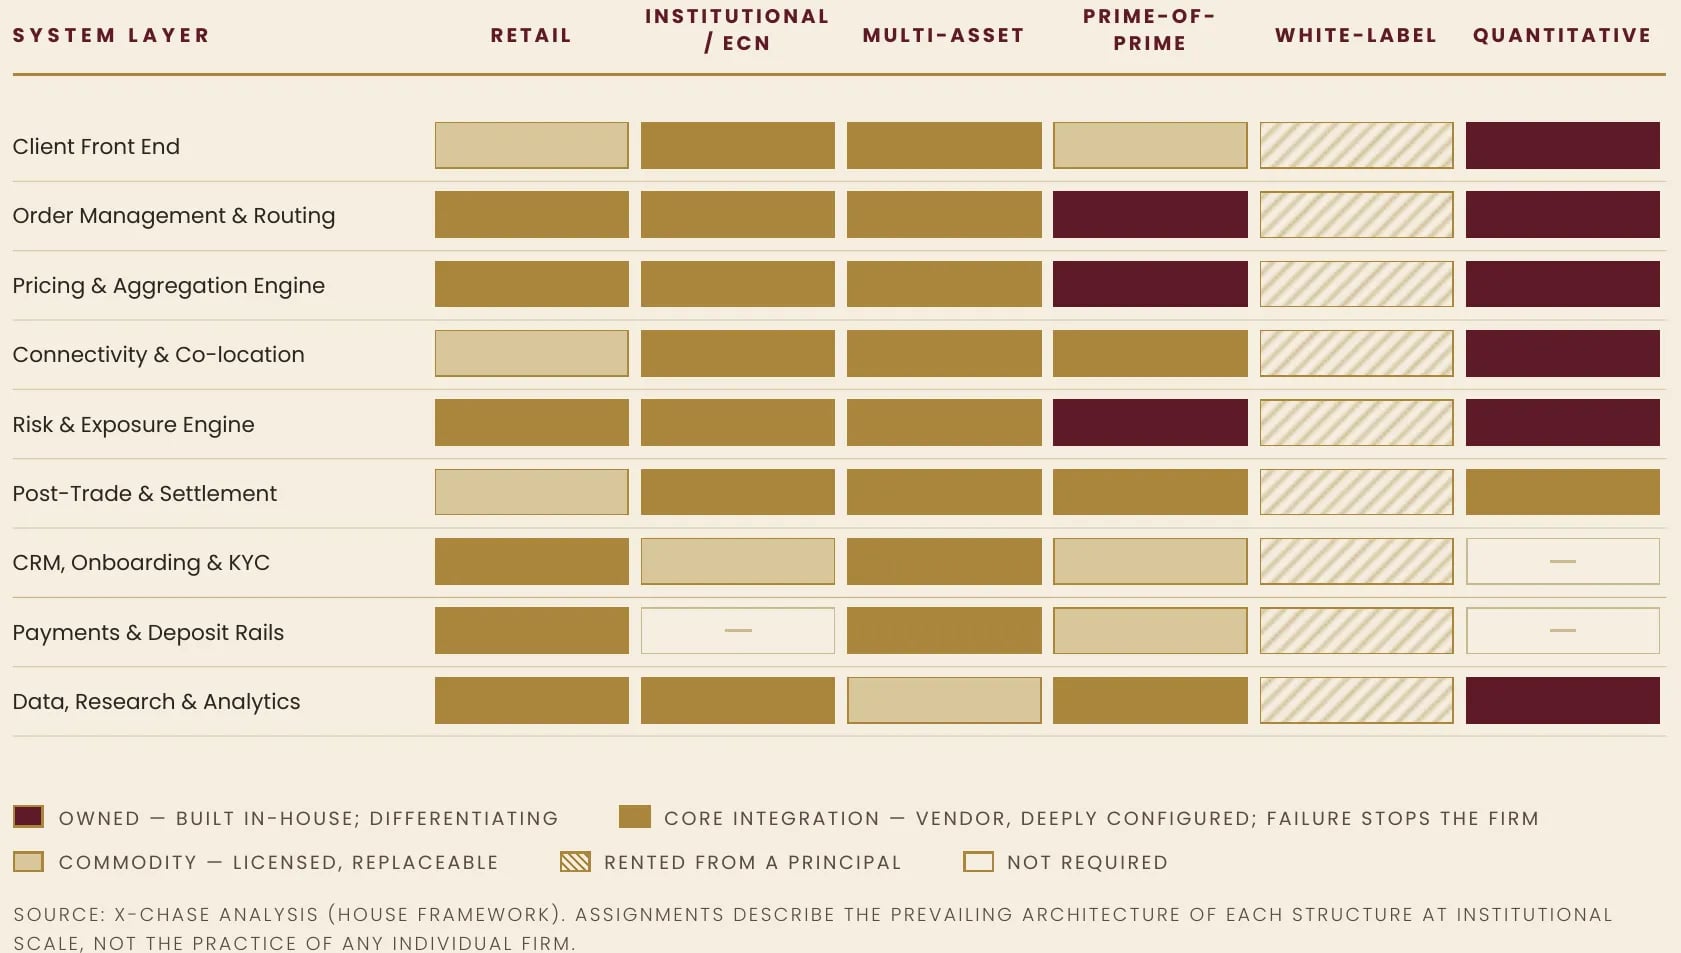
Four readings of that grid carry most of its value.
- The Prime-of-Prime owns the middle of the stack. Pricing, aggregation, routing and exposure are not vendor selections for this house; they are the product. A Prime-of-Prime that has outsourced them is reselling somebody else’s business at a thinner margin and calling the result a firm.
- The retail house’s differentiating build is not the trading platform. It is customer relationship management, payment rails and flow analytics — the three layers vendors discuss least and where the operator’s real intellectual property accumulates. A firm that cannot classify its own flow cannot price its own risk.
- The white-label operator owns one column of nothing. Every layer is rented, which is precisely why the four contractual terms set out in Section III are the whole of that structure’s strategy.
- The quantitative house has no client-facing layers at all and owns everything that remains. Its cost base has no analogue in any client-facing structure, and comparisons of margin between the two are meaningless.
The technology decision is downstream of the structural decision. Reverse the order and the architecture will quietly select the business.
Plane Two — Liquidity
Liquidity is the plane the industry discusses most and understands least, because the question is habitually framed as who rather than how many, on what terms, and what happens when one of them leaves.
Exhibit 8 — The Liquidity Architecture
| Source | Providers — house planning benchmark | |
|---|---|---|
| Prime Brokerage | Grants access; supplies none | Not applicable |
| Prime-of-Prime | Tier-1 banks plus non-bank makers | 8–20, curated as the product |
| ECN / DMA | Competing streams into one book | 10+ for credibility |
| Institutional | Multi-provider aggregation | 6–15, actively managed |
| Multi-Asset | A separate stack per asset class | Multiple in parallel |
| Retail | Prime-of-Prime and non-bank makers | 1–3 at launch; 6–12 at maturity |
| Private | Prime-of-Prime plus banking partners | 2–5, relationship-led |
| White-Label | Whatever the principal passes down | None owned |
| Proprietary | Direct market access or Prime-of-Prime | 1–3 |
| Quantitative | Is the liquidity | Not applicable |
Source: X-CHASE analysis (House Framework). Provider counts are house planning benchmarks, not survey data.
One line of that exhibit deserves emphasis. A retail house running a single liquidity provider does not have a procurement inefficiency; it has a solvency exposure. If that provider withdraws, reprices, or is itself disconnected by its own prime, the broker is out of the market with no notice and no remedy. Redundancy in liquidity is not a cost of sophistication. It is the price of continuing to exist.
The second under-examined term is symmetry. A house should be able to demonstrate, from its own execution records, that positive and negative slippage occur in comparable proportion, that rejection rates are stable across volatility regimes, and that last-look windows are documented rather than inferred. A provider unwilling to be measured on those three is not offering liquidity; it is offering an option written against the broker’s clients.
Plane Three — Regulation and Capital
The published minima are the floor and never the requirement, but the floor tells you what each jurisdiction believes it is regulating. The ledger below sets out the entry thresholds of the jurisdictions this industry actually uses.
Exhibit 9 — The Regulatory Ledger
Jurisdiction and instrument · Minimum capital
- UKUnited Kingdom — FCA · MIFIDPRU 4.4£750,000 permanent minimum for dealing on own account, underwriting or placing on a firm-commitment basis, or operating an unrestricted organized trading facility; £150,000 where the firm holds client money or assets without those permissions; £75,000 for the narrowest permissions. The own-funds requirement is the higher of the permanent minimum and the fixed overheads requirement — one quarter of the prior year’s relevant expenditure — and for most real firms the fixed overheads requirement binds.
- EUEuropean Union — IFR / IFD€750,000 / €150,000 / €75,000, on the same logic. Cyprus, the industry’s principal EU domicile, applies this framework.
- AUAustralia — ASIC · Instrument 2022/705, RG 166Retail OTC derivative issuers must hold net tangible assets of the greater of AUD 1,000,000 or 10% of average revenue; 50% in cash or cash equivalents and 50% in liquid assets; quarterly twelve-month cash-flow projections; notification to ASIC within three business days if NTA falls below 110% of the requirement. The instrument runs to 1 October 2027.
- ADGMAbu Dhabi Global Market — FSRA · PRU RulebookBase capital: Category 1 (deposit-taking) USD 10,000,000; Category 2 (dealing as principal, providing credit) USD 2,000,000; Category 3A (matched principal, agency) USD 500,000; Category 3C USD 500,000, with lower thresholds for certain fund managers; Category 4 USD 50,000 following the 2025 prudential revisions, with USD 150,000 for private financing platforms. Risk-based minima of 6% CET1 and 8% Tier 1 on total risk exposure, plus a 2.5% capital conservation buffer where risk capital binds.
- SCSeychelles — FSA · Securities Act 2007Minimum issued and paid-up capital for a Securities Dealer is USD 100,000, raised from USD 50,000 by the Securities (Amendment) Act 2024, with existing licensees required to comply by 30 June 2026. A large proportion of published guidance still quotes the superseded figure.
- MUMauritius — FSC · Securities (Licensing) Rules 2007Minimum stated unimpaired capital: Investment Dealer (Full Service including underwriting) MUR 10,000,000; (Full Service excluding underwriting) MUR 1,000,000 — the category most foreign exchange and CFD operators hold; (Broker) MUR 700,000; (Discount Broker) MUR 600,000. Professional indemnity cover is additionally required, scaled to volume and risk.
Source
FCA Handbook MIFIDPRU 4.4 and 4.5; EU Investment Firms Directive; ASIC Instrument 2022/705 and Regulatory Guide 166; ADGM FSRA PRU Rulebook and 2025 prudential amendments; Seychelles Securities Act 2007 as amended 2024; Mauritius Securities (Licensing) Rules 2007, Fourth Schedule. Figures are minima and subject to change; verify against the current rulebook before acting.
The Seychelles line is a lesson in the information quality of this industry. A statutory capital requirement doubled in 2024 and a substantial share of the advisory material in circulation has not caught up. If the published capital figure for a jurisdiction cannot be relied upon, nothing else published about that jurisdiction should be relied upon either.
Plane Four — Banking and Payments
This is the plane on which offshore-licensed houses most often fail, and it is almost never modeled at the point the jurisdiction is chosen. The binding constraint on such a broker is rarely the license. It is banking and payments. A house that cannot open a corporate account, cannot retain a payment service provider, or loses a local deposit rail is out of business within weeks, whatever its capital position and whatever its regulator permits.
The jurisdiction decision is therefore a banking decision wearing regulatory clothing, and it should be taken in that order: establish which banks and which payment providers will serve a firm of this type in this market, on what terms and with what concentration, and only then select the license that those counterparties will accept. Reversing the sequence produces a licensed company that cannot take a deposit.
Note also how completely this plane diverges by structure. The retail house needs consumer deposit rails in every market it sells into, redundantly, and treats payment failure as an existential event. The institutional and Prime-of-Prime houses need institutional settlement and no consumer rails at all. The quantitative house needs clearing and custody and takes no deposits in any form. These are not different intensities of the same requirement. They are different requirements.
Plane Five — Organization and Human Capital
The map below is the functional inventory of a client-facing brokerage, mapped to the institutional capabilities of the X-OS. No house requires all of it. Every house requires a defensible answer for each line, including this is outsourced, and here is to whom, and here is what happens if they stop.
Exhibit 10 — The Departmental Map
| X-OS layer | The point of it | |
|---|---|---|
| Dealing & execution | Liquidity | Decides what is passed and what is held — the highest-leverage desk in the firm |
| Risk management | Risk | Must be independent of dealing; where it is not, the firm has a second dealer, not a risk function |
| Liquidity relations | Liquidity | Provider selection, feed quality, and the maintenance of more than one credible relationship |
| Technology | Technology | Its real job is preserving the firm’s ability to leave any single vendor |
| Compliance & AML | Regulatory | In an authorized firm this department is not a cost center; it is the license |
| Finance & treasury | Banking | Daily client-money reconciliation — where regulatory failure most often begins |
| Payments & banking | Banking | The binding operational constraint in every emerging market |
| Client support | Operations / CRM | Scales with client count, not revenue — the most misestimated line in most business plans |
| Sales & retention | CRM | The most conduct-sensitive department, and the first one a regulator examines |
| Partnerships & IB | Marketing / CRM | Most new volume in emerging markets — and most incoming conduct risk |
| Data & analytics | Technology / CRM | A firm that cannot classify its own flow cannot price its own risk |
| Human capital | Human Capital | Dealing, compliance and liquidity personnel are scarce, mobile, and hold the institutional memory |
Source: X-CHASE analysis (House Framework). Executive and board composition is omitted: those are regulator-approved individuals, not organizational preferences. Legal, marketing, onboarding and back office are assumed throughout.
The retail house is the only structure that requires every one of those functions at full weight. That is not a sign of its sophistication. It is a measure of how much machinery must be assembled to convert small, high-churn, adversarially acquired tickets into revenue.
Plane Six — Distribution and Acquisition
Distribution differs more sharply across these houses than any other plane, and it is the one most frequently copied from the wrong model. The retail house buys clients: paid media, affiliate and introducing-broker networks, and a retention apparatus, at a cost that rises in every regulated market as advertising restrictions tighten. XTB’s 2025 disclosures make the scale of this visible — operating costs of PLN 1.31 billion for the year, of which PLN 585.0 million was marketing: nearly half the entire cost base of a profitable, listed, multi-market broker devoted to acquisition alone.
The institutional house does not buy clients at all; it earns them over sales cycles measured in quarters, on execution statistics and credit terms. The private house acquires exclusively by referral and would be damaged by paid marketing. The Prime-of-Prime acquires through the vendor and technology ecosystem, and through the brokers it already serves. The quantitative house has no acquisition function in any form.
An operator who builds a retail acquisition machine and then attempts to sell to institutions has bought the wrong asset; an operator who attempts to reach retail through relationship selling will not reach scale. The distribution model is not a marketing preference. It is a property of the structure.
Plane Seven — Terminal Value
Finally, and least often examined at founding: these structures are not worth the same multiple, and the choice of structure is therefore also a choice of exit.
A retail house is valued on the quality and durability of its regulated client base, the proportion of revenue that is recurring rather than volatility-dependent, and the breadth of its license portfolio — which is why the acquisitive firms in this industry buy licenses and client books rather than technology. A Prime-of-Prime is valued on its credit relationships, its counterparty permissions and its infrastructure, all of which are difficult to replicate and therefore command a premium. A white-label operation has, strictly, a client list and a brand; whether either transfers depends entirely on the four contractual terms named earlier. A quantitative firm is rarely sold at all, because what would be purchased is a research organization that can leave.
The structure chosen at founding sets the ceiling on what the house can eventually be sold for. That ceiling is fixed years before anyone thinks to ask about it.
The Cost of Entry
Regulatory minima are quoted constantly and mean almost nothing, because no house has ever been funded by its license requirement. What matters is the all-in capital required to reach the twelfth month with a functioning institution and a marketing budget that has survived a bad quarter.
The House states its planning benchmarks openly, with the caveat that they are benchmarks and not quotations. Every real number is a function of jurisdiction, asset coverage, distribution model and the terms a specific upstream counterparty is willing to extend. They are stated here because the alternative — the industry convention of quoting a license minimum and calling it a budget — has funded more failures than any other single practice.
Exhibit 11 — The Cost of Entry by Structure
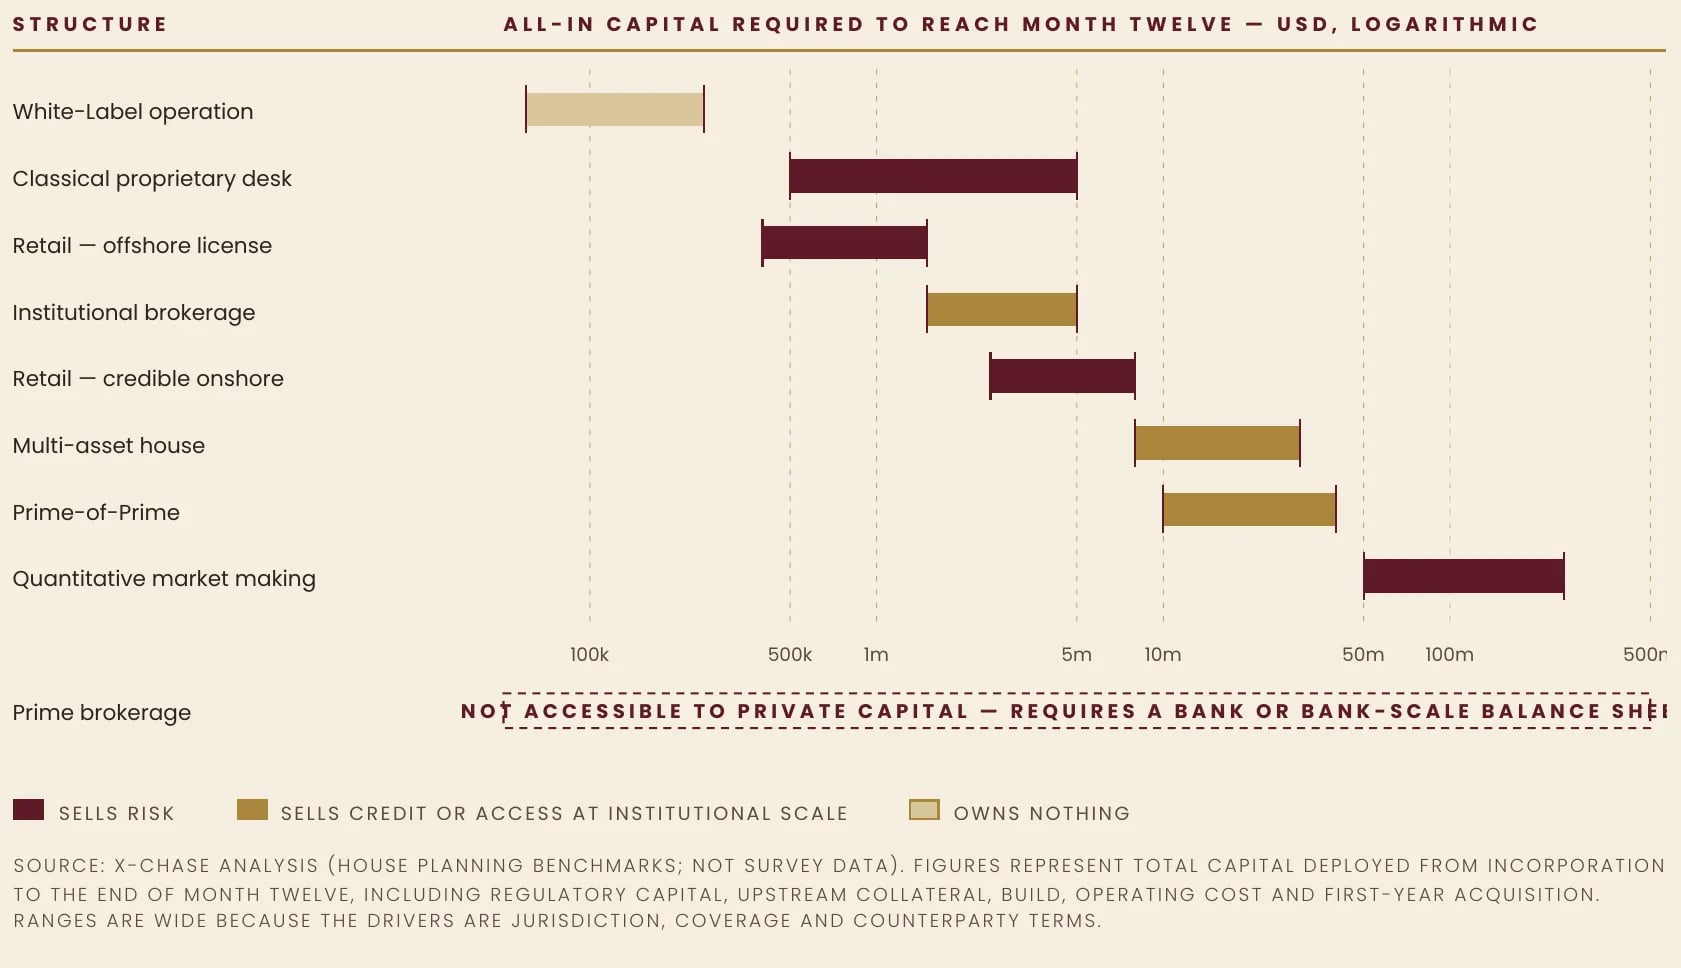
Two features of that picture are worth stating plainly. The first is that the gap between an offshore retail launch and a credible onshore one is roughly an order of magnitude, and almost none of that gap is the license itself. The second is that the Prime-of-Prime sits an order of magnitude above the retail house not because its permissions cost more but because its upstream counterparty demands collateral before it will extend a single line of credit — the same closure described in Section IV, expressed as a number.
Exhibit 12 — Where the Capital Actually Goes
Retail — offshore license · first twelve months, USD
- 1Regulatory capital25k – 100k
- 2Incorporation, legal & licensing process30k – 80k
- 3Upstream collateral & liquidity deposits50k – 250k
- 4Technology build & integration60k – 200k
- 5Banking & payment onboarding20k – 60k
- 6Operating cost, twelve months150k – 500k
- 7Client acquisition, twelve months100k – 500k
- =All-in, to month twelve0.4m – 1.5m
Retail — credible onshore · first twelve months, USD
- 1Regulatory capital750k – 2m
- 2Incorporation, legal & licensing process150k – 400k
- 3Upstream collateral & liquidity deposits250k – 1m
- 4Technology build & integration200k – 600k
- 5Banking & payment onboarding50k – 150k
- 6Operating cost, twelve months700k – 2m
- 7Client acquisition, twelve months500k – 2m
- =All-in, to month twelve2.5m – 8m
Prime-of-Prime · first twelve months, USD
- 1Regulatory capital750k – 2m
- 2Incorporation, legal & licensing process200k – 500k
- 3Upstream collateral & liquidity deposits5m – 25m
- 4Technology build & integration1m – 4m
- 5Banking & payment onboarding100k – 300k
- 6Operating cost, twelve months1.5m – 5m
- 7Client acquisition, twelve months100k – 400k
- =All-in, to month twelve10m – 40m
Source
X-CHASE analysis (house planning benchmarks). Excludes contingency, which the House holds should be reserved at approximately ten percent outside all deployment lines and not drawn in phase one.
Read the columns against one another and the structural argument of this study becomes an arithmetic one. The retail house’s largest discretionary line is acquisition; the Prime-of-Prime’s largest line by an order of magnitude is collateral posted with a counterparty that has not yet agreed to serve it. One is buying clients. The other is buying a permission.
This is also where most launch plans reveal their defect. Capital is allocated to the items with invoices — license, platform, office, incorporation — and the two lines with no invoice attached are the ones left underfunded: operating runway and acquisition. A house that reaches month nine with a license, a platform, a team and no marketing budget has not built an institution. It has built a cost base and given it a name.
Most of what is committed should remain inside the institution as capital. Very little of it should leave as cost.
Where the Money Actually Is
The most reliable way to understand these houses is to divide their revenue by their headcount. The exercise strips away positioning and leaves the structure exposed.
Exhibit 13 — Revenue per Employee Across the Tiers
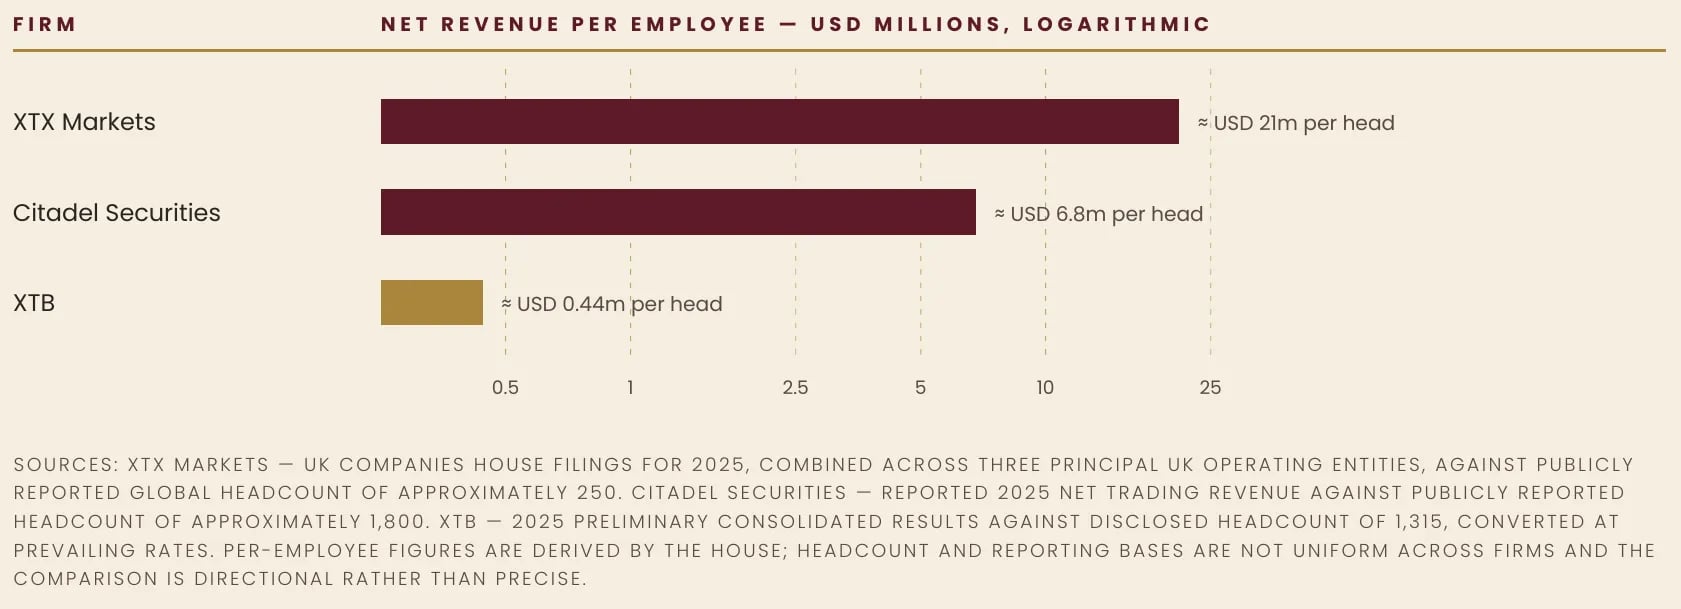
The gap is not a gap in quality of management. It is the tier structure made visible in a single ratio. A quantitative house at the top of the pyramid earns in the region of forty to fifty times per head what a large, well-run, publicly listed retail house earns, because it sells risk-bearing and pricing at the source and requires no support, no retention, no onboarding, no marketing, and no acquisition. A retail house earns what it earns because it must first buy every client it has, twice — once through marketing and once through the machinery required to keep them.
Exhibit 14 — The Listed Retail Family, 2025
| Latest disclosed | Observation | |
|---|---|---|
| IG Group | £1,123.4m total revenue; £1,004.6m net trading revenue; £531.1m EBITDA at a 47.3% margin, for the twelve months to 31 December 2025 | Scale and license breadth; growth increasingly bought through acquisition of adjacent platforms |
| Plus500 | $792.4m revenue; $348.1m EBITDA; 242,440 active customers; ARPU $3,268; average deposit per active customer approximately $26,900 | The highest revenue per client in the listed family, on a deliberately narrowed customer base |
| XTB | PLN 2,146.1m operating income; PLN 644.2m net profit, down 24.9%; 1.19m active clients; operating costs PLN 1.31bn, of which PLN 585.0m marketing | Record revenue and falling profit — the cost of buying market share in this structure |
Source: Company results announcements and preliminary disclosures for the 2025 financial year. Definitions of “active client” are not uniform across firms and the figures are not directly comparable.
Note the spread within the retail family itself. Revenue per active client between the highest and the lowest of those three operators differs by something in the order of sixfold or sevenfold, on each firm’s own definition. That is not a difference in product. It is a difference in acquisition strategy, client segment and regulatory perimeter, and it demonstrates that retail broker is not a business model either — it is four or five business models sharing a license category.
Note also XTB’s year. Record operating income, a quarter off net profit, and marketing consuming forty-five percent of the entire cost base. That is the retail structure operating exactly as designed, in the hands of competent management, in a good market: growth is available, and it is purchased at a price that compresses the margin while it is being bought.
Exhibit 15 — Where the Margin Lives
| Which house | Character | |
|---|---|---|
| Spread mark-up | Retail, Prime-of-Prime | Invisible to the client by construction |
| Commission | ECN, institutional | Disclosed; compressed yearly |
| Internalized P&L | Retail | Highest margin, highest variance, adversarial |
| Swap and financing | Retail, multi-asset | Asymmetric in most retail books |
| Interest on client money | Retail, multi-asset | Rate-dependent; uncorrelated with client outcomes |
| Volume rebates | Retail, ECN | Received from providers and venues |
| Technology and white-label fees | Prime-of-Prime, principal brokers | Rent on infrastructure |
| Evaluation fees | Evaluation model | Recurring, high margin, regulatorily unsettled |
| Financing and lending | Prime brokerage | The most durable line in the industry |
| Custody and corporate actions | Multi-asset | Small per unit, very stable |
Source: X-CHASE analysis (House Framework).
Read the exhibits together and the doctrine of this study appears on its own. Move up the tiers and revenue shifts from client losses toward infrastructure rents. The retail house earns most from the client who does worst; the Prime-of-Prime earns most from the client who does most volume; the prime broker earns most from the client who borrows most. Only the first of the three is adversarial — and only the first is therefore permanently exposed to reversal by legislation.
A rent charged for a service can be defended. A rent extracted from a conflict is defended only until someone writes it down.
The Failure Modes
Four failures recur, and each belongs to a different family. A house should know which of them is aimed at it.
One — The Liquidity Event
On 15 January 2015 the Swiss National Bank removed the EUR/CHF floor. Retail houses holding client positions that gapped straight through their stops discovered that negative balance protection is a promise made by the broker and not by the market. Several failed within hours.
The lesson was never about Swiss francs. It was that a broker’s stated risk limits are only as real as the liquidity available to enforce them — and liquidity is precisely what disappears in the event those limits exist to survive. Aimed at: sellers of risk.
Two — The Credit Event
Archegos Capital Management in 2021 demonstrated the same failure running upward. Concentrated, embedded leverage was distributed across several prime brokers, each of which saw only its own slice; Credit Suisse lost approximately $5.5 billion and left the prime business.
In a brokerage the analogue is exposure to a single liquidity provider or a single payment processor that is invisible on the risk report because nothing on the risk report was built to see it. Aimed at: sellers of credit.
Three — The Counterparty Withdrawal
A house whose liquidity rests on one Prime-of-Prime, which rests on one prime, is three credit committees away from disconnection and will receive no warning. This is the credit gate of Study No. 01 seen from underneath: access is bought with relationships rather than cash, and when a line is cut the participant is removed from the tier outright, whatever price he was willing to pay. Aimed at: sellers of access.
Four — The Regulatory Reclassification
The evaluation-model segment grew from near-invisibility to a market measured in billions and then contracted violently, with a substantial proportion of the firms trading in early 2024 closed or materially restructured by the end of 2025. The business model did not change. The regulatory and platform environment around it did.
Any house whose economics depend on a classification that has not yet been settled is carrying a risk it cannot hedge and should not capitalize as if it could. Aimed at: the unsettled.
The Verdict of the House
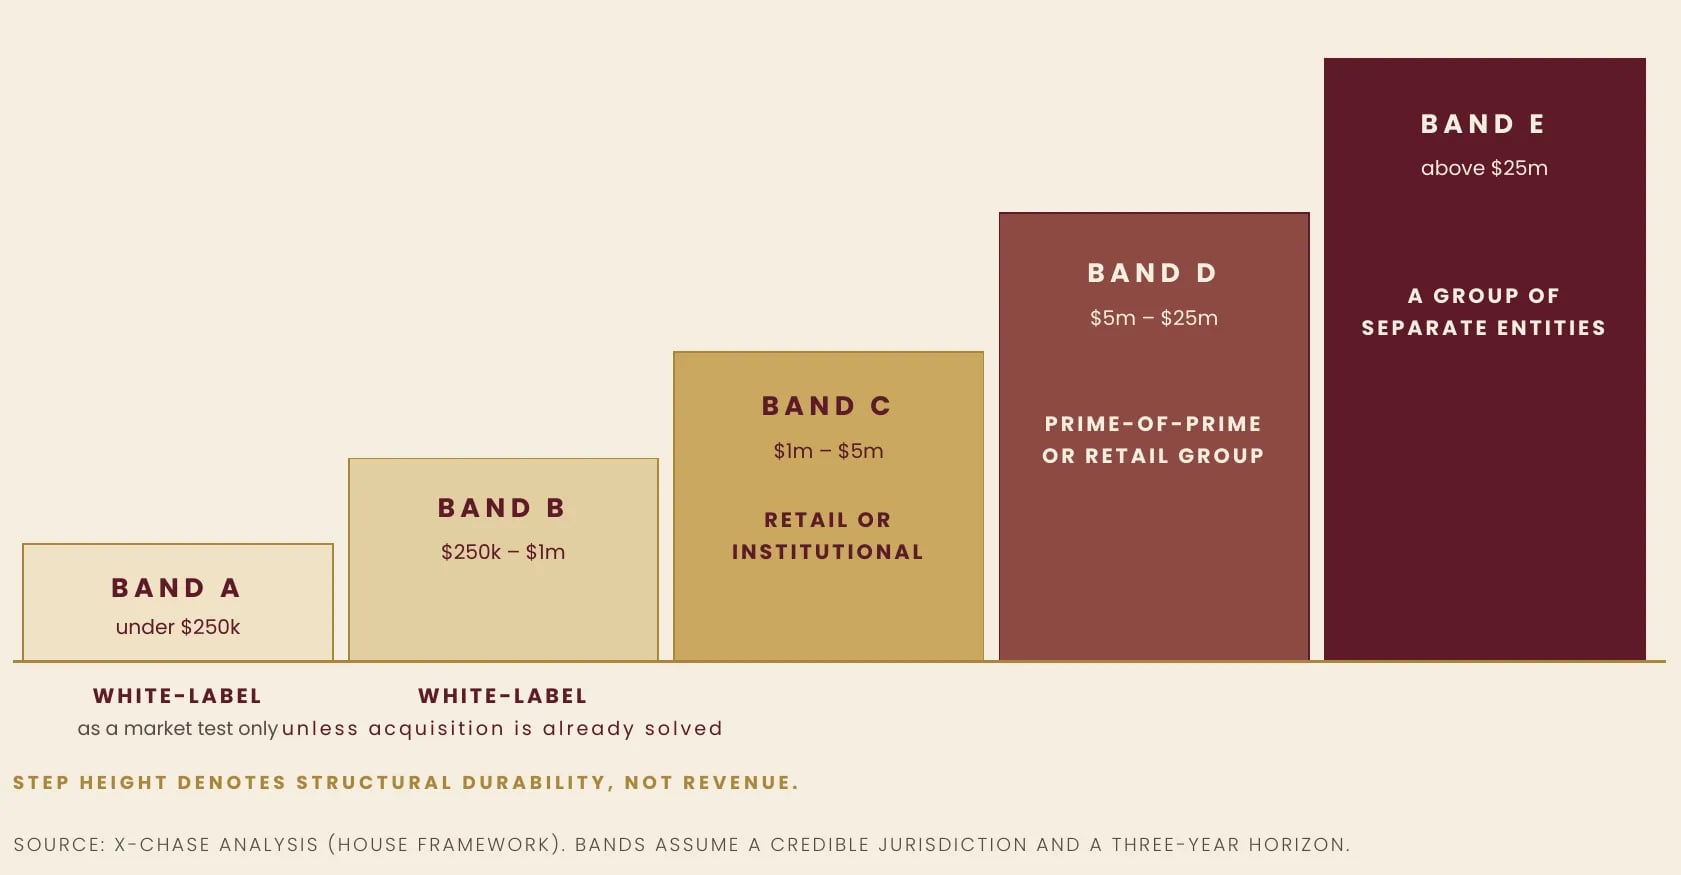
The question an owner of capital actually asks is not what the types of broker are. It is: given what I have, what should I build. The House answers by band, assuming a credible jurisdiction and a three-year horizon.
Exhibit 16 — The Bands
Band A · Under USD 250,000
Build a white-label, explicitly as a market test, and negotiate data portability and client ownership at the outset because they will not be available later. Reject everything else. At this level a license, real liquidity and a compliant organization cannot be funded simultaneously, and any proposal that claims otherwise is funding one of the three by starving the other two.
Band B · USD 250,000 to 1,000,000
This is the band in which most brokerages are launched and most fail. The capital is sufficient for a license, a platform, a liquidity connection and a small team — and insufficient for the acquisition spend those things exist to support. The House position is that a launch here is viable only where client acquisition is already solved before the license is applied for: an existing introducing-broker network, an existing community, an existing institutional relationship. Absent that, this band is better deployed as Band A plus patience.
Band C · USD 1,000,000 to 5,000,000
Build a retail or institutional house in a credible jurisdiction, hybrid-book from the first day. This is the first band at which the full structure is genuinely fundable — real license, real risk function, multiple liquidity providers, redundant payment rails, and a marketing budget that survives a bad quarter. The choice between retail and institutional should be made deliberately rather than by default: retail is faster to revenue and permanently exposed to conduct regulation; institutional is slower, concentrated, and structurally more durable. Note that the upper half of this band buys a credible onshore launch and the lower half does not.
Band D · USD 5,000,000 to 25,000,000
Build a Prime-of-Prime, or a multi-jurisdictional retail group. The House regards the Prime-of-Prime as the most attractive risk-adjusted position available to private capital in this industry: it earns from credit and infrastructure rather than from client losses; its clients are institutions with long lifetimes and low churn; it is insulated from the retail regulatory cycle; it occupies the tier through which the whole chain must pass; and it commands the higher terminal multiple for exactly those reasons. Its difficulty is precisely its defensibility.
Band E · Above USD 25,000,000
The question changes from which structure to which combination, and the answer is a group: an institutional entity holding the liquidity and credit relationships, a retail entity holding the distribution, and separate licensed entities isolating regulatory risk by market. Every large operator in this industry is organized this way. It is not an accident and it is not a tax structure. It is risk containment.
What the House Does Not Recommend Building
Prime brokerage — because it is not accessible.
Top-tier quantitative market making — because it requires an existing research organization and a latency infrastructure that costs more than most brokerages are worth.
The evaluation model as a primary business — because its terminal value depends on a regulatory outcome nobody can presently underwrite, though it is defensible as an acquisition channel attached to a licensed house.
The pure B-book — not because internalization is illegitimate, but because internalization without the apparatus to measure, cap and hedge it is not a business model at all.
The Doctrine
Every structure in this study solves the same problem — the distance between an owner of capital and the price at the apex — and each solves it by selling one of three things.
Those who sell access compete on execution and are compressed by technology, which improves every year and belongs to everyone. Those who sell risk earn the most, are regulated the hardest, and are the only participants whose revenue depends on their clients doing badly; they may run that conflict, but only under governance that makes it explicit. And those who sell credit are paid for a permission rather than a service, which is why they are the gate the other two must pass through, and why the position takes years to earn and cannot be bought.
The choice among them is made once. Build for the tier the house is intended to occupy in five years, not the one its capital can reach today, because these structures do not convert into one another. Growth does not turn a retail broker into a Prime-of-Prime; volume does not turn a white-label operator into a broker. Each transition is a rebuild, financed at the worst possible moment, against a competitor who began where you are trying to arrive.
And the choice is never a single choice. It is a technology architecture, a capital structure, a licensing perimeter, a banking arrangement, an organizational shape, a distribution model and a terminal value, all selected at once and all constrained by one another. This is why the decision cannot be assembled incrementally from vendor conversations. There is no plane on which it is safe to decide first and think afterwards.
Sell access and you compete forever. Sell risk and you are legislated forever. Sell credit and you are the gate.
The distance is the business. Everything else is decoration.
Closing · The Position of the House
This study has argued that the structure of a brokerage is decided once, that it is decided across seven planes simultaneously, and that it is very nearly irreversible. That is the reason X-CHASE holds the position it does on sequence.
The conventional path into this industry runs the other way. A principal decides to establish a brokerage, and the first substantive conversations are with vendors — a platform provider, a liquidity provider, a licensing agent — each of whom is competent, each of whom answers the question put to him, and none of whom is positioned to ask whether the structure being assembled is the right one. By the time the architecture is visible, it has already been selected: by the platform that determined the client segment, by the jurisdiction that determined the banking constraint, by the liquidity arrangement that determined the dependency. The design was made. It simply was not made deliberately, and it was not made by the principal.
Design before procurement. The order of those two words is the difference between an institution and an assembly of vendor contracts.
The House therefore holds that the structural work belongs at the beginning, before a license is applied for, before a platform is licensed, before a liquidity agreement is signed — and that it should be conducted as a discrete, paid, fixed-scope engagement whose deliverable is an architecture rather than an introduction. That engagement establishes the objective and the capital available; tests the intended structure against the two coordinates set out in this study; selects the tier the house is to occupy and the origin of profit it will run; and then specifies, across all seven planes, the technology architecture, the liquidity structure, the regulatory pathway, the banking arrangement, the organizational design, the distribution model and the capital deployment schedule that follow from that single decision. Only then does procurement begin, against a specification the principal owns.
The economics of doing this properly are not close. The cost of a structural study is a rounding error against the figures in Exhibit 12, and it is measured against the alternative of discovering, in month fourteen, that the house that was built is not the house that was needed — at which point the remedy is not an adjustment but a rebuild, financed at the worst possible moment.
X-CHASE designs, launches and manages financial institutions. It does not sell technology, and it holds no economic interest in which vendors a client selects. Its function on this plane is singular and it is stated plainly: to ensure that the structure is chosen by the owner of the capital, deliberately, at the only moment when the choice is still free.
Standing Disclosure
X-CHASE is an institutional financial systems firm. It is not a regulated financial institution, bank, broker, asset manager or authorized investment advisor, and nothing in this study constitutes investment, legal, regulatory or tax advice. Engagements are structural and advisory in character; regulatory applications, legal opinions and audited representations are the province of licensed professionals appointed by the client, and X-CHASE gives no guarantee of any regulatory outcome.
Apparatus
A Note on Sources
Market structure. Turnover data is drawn from the BIS Triennial Central Bank Survey for April 2025, published 30 September 2025, which records global foreign exchange turnover of $9.6 trillion per day, an increase of 28% on 2022; the US dollar on one side of 89% of all trades; the United Kingdom, United States, Singapore and Hong Kong SAR accounting for 75% of turnover; and prime-brokered turnover of $2.163 trillion per day, up 64.2%.
Retail outcomes. Loss-rate data is drawn from the analyses of national competent authorities cited by ESMA in support of its 2018 product intervention measures. Provider-specific figures referenced in general terms are those published under mandatory disclosure requirements by regulated operators.
Regulatory capital. Figures are drawn from the FCA Handbook (MIFIDPRU 4.4 and 4.5); the EU Investment Firms Directive; ASIC Instrument 2022/705 and Regulatory Guide 166; the ADGM FSRA PRU Rulebook including the 2025 prudential amendments; the Seychelles Securities Act 2007 as amended by the Securities (Amendment) Act 2024; and the Mauritius Securities (Licensing) Rules 2007, Fourth Schedule. All such figures are minima and are subject to change.
Firm-level financial data. Figures for the 2025 financial year are drawn from published company filings, results announcements and preliminary disclosures: XTX Markets (UK Companies House filings across its principal UK operating entities), Citadel Securities, IG Group Holdings plc, Plus500 Ltd and XTB S.A. Per-employee figures are derived by the House; headcount and reporting bases are not uniform across firms and the comparison is directional rather than precise. Evaluation-segment figures are drawn from the published accounts of FTMO’s parent holding, from the firm’s own announcement of the completion of its acquisition of OANDA on 1 December 2025, and from an FPFX Tech study of more than 300,000 accounts across ten firms.
House benchmarks. Provider counts, functional weightings, technology-architecture assignments, cost-of-entry ranges and capital bands are House planning benchmarks and are identified as such wherever they appear. They are not survey data, and they are stated to be tested against a specific mandate rather than applied generically.
Named firms. Technology and liquidity providers named in this study are referenced solely as market participants for the purpose of describing industry structure. No affiliation, partnership, endorsement or commercial relationship is stated or implied. Named brokerage and trading firms are referenced solely on the basis of their public disclosures.
Disclaimer
This study is published by the Office of Institutional Intelligence of X-CHASE for informational purposes. It does not constitute investment, legal, regulatory or tax advice, nor a recommendation to enter into any transaction or to establish any business. X-CHASE is not a regulated financial institution, bank, broker, asset manager or authorized investment advisor. Figures are stated as at the date of publication; readers must verify all regulatory requirements against the current rules of the relevant authority and take independent professional advice before acting.